

6351
FIRES IN INDUSTRIAL AND MANUFACTURING PROPERTIES - PART 4
07/03/2018
Table 19.
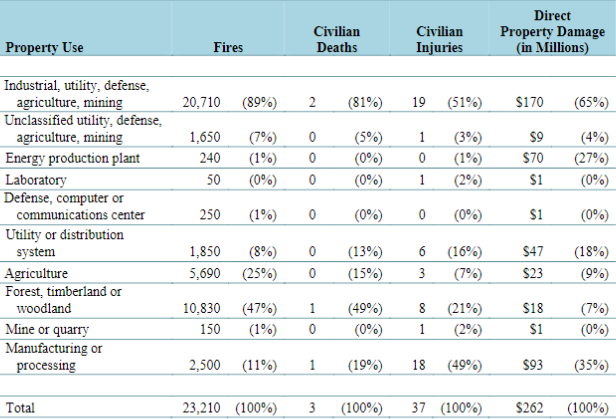
Structure Fires in Manufacturing PropertiesBy Item First Ignited, 2011-2013 Annual Averages
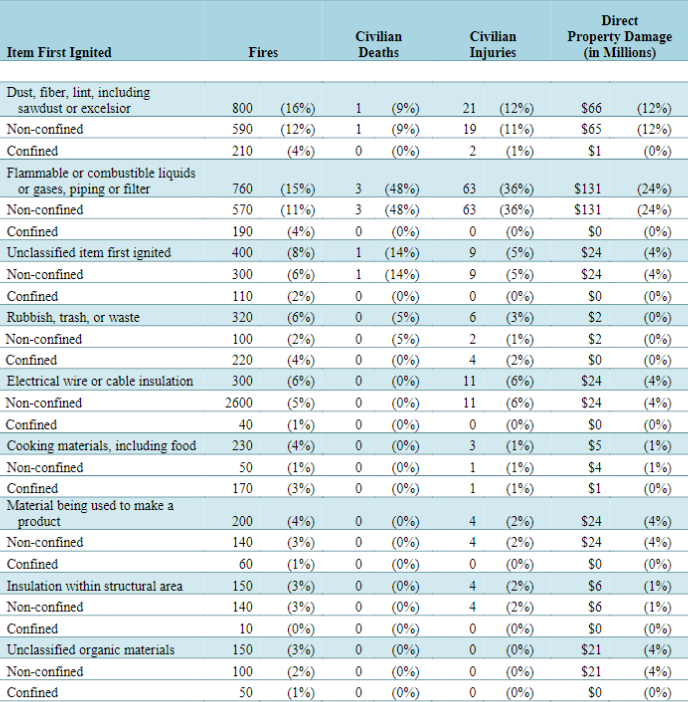
Table 19.
Structure Fires in Manufacturing PropertiesBy Item First Ignited, 2011-2015 Annual Averages (Continued)
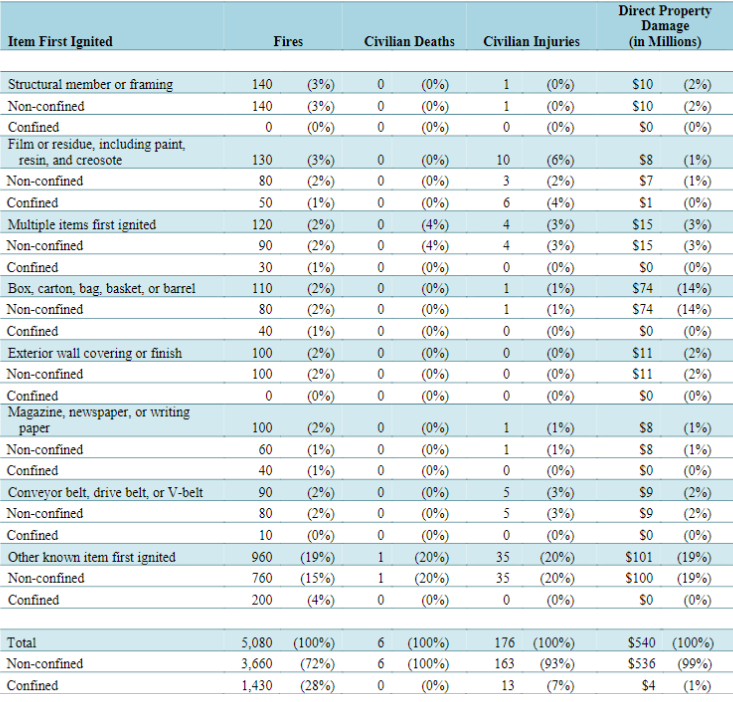
Note: Sums may not equal totals due to rounding errors. Confined structure fires (NFIRS incident type 113-118) were analyzed separately from non-confined structure fires (incident type 110-129, except 113-118). See Appendix A for details.Source: NFIRS 5.0 and NFPA Fire Experience Survey.
Table 20.
Structure Fires in Manufacturing PropertiesBy Extent of Flame Spread, 2011-2015 Annual Averages
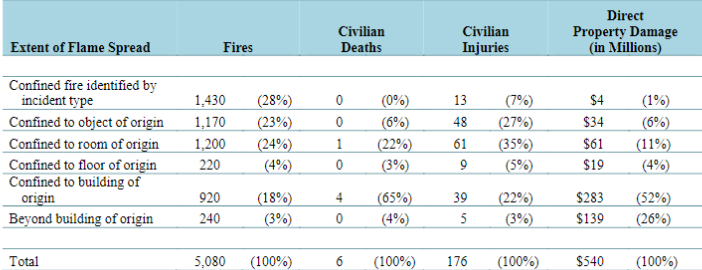
Note: Sums may not equal totals due to rounding errors. Source: NFIRS 5.0 and NFPA Fire Experience Survey.
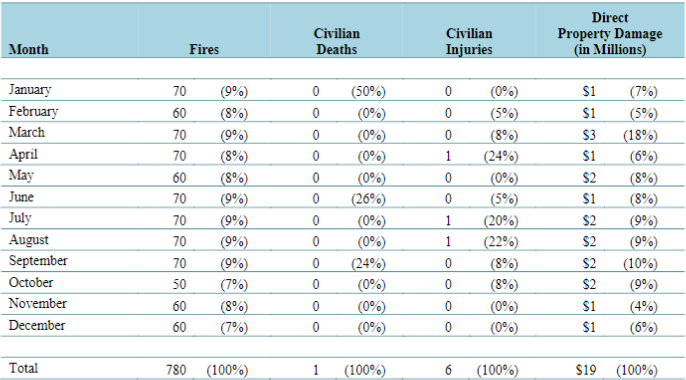
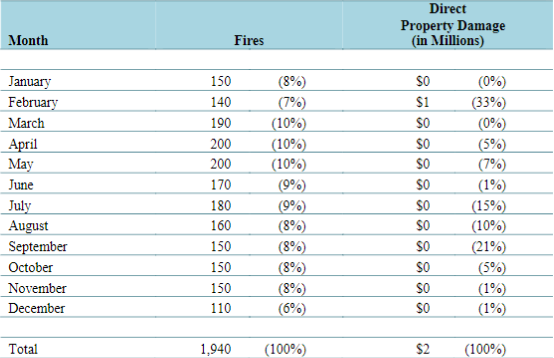
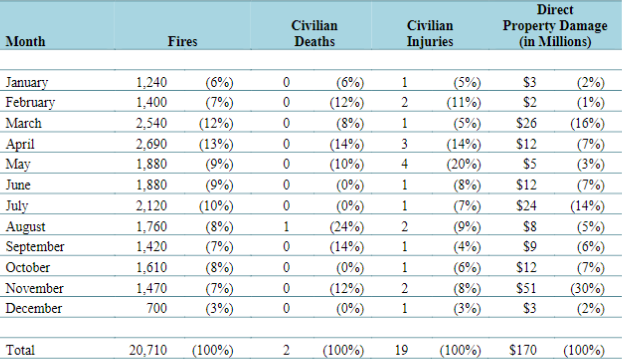
Table 21.
Vehicle Fires in Industrial PropertiesBy Month, 2011-2015 Annual Averages
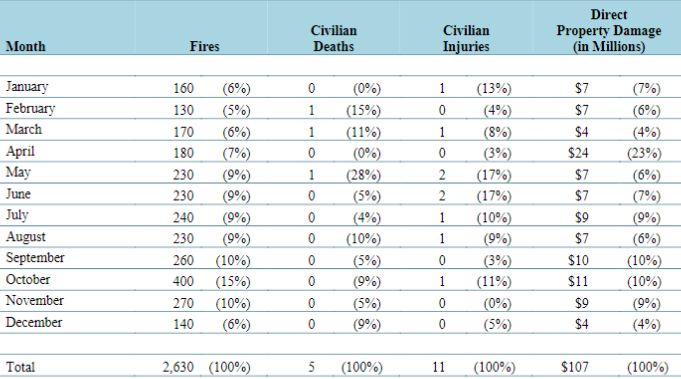
Note: Sums may not equal totals due to rounding errors. Fires are rounded to the nearest ten, civilian deaths and injuries to the nearest one, and direct property damage is rounded to the nearest million dollars.
Source: NFIRS 5.0 and NFPA Fire Experience Survey.
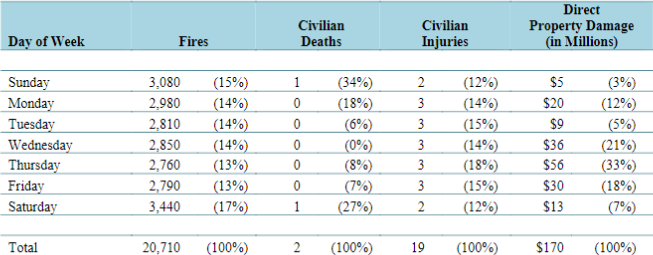
Table 22.
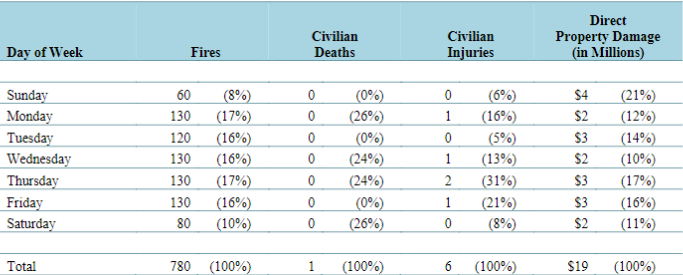
Vehicle Fires in Industrial PropertiesBy Day of Week, 2011-2015 Annual Averages
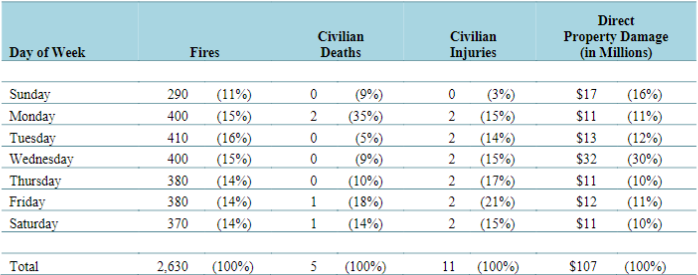
Note: Sums may not equal totals due to rounding errors. Fires are rounded to the nearest ten, civilian deaths and injuries to the nearest one, and direct property damage is rounded to the nearest million dollars.
Source: NFIRS 5.0 and NFPA Fire Experience Survey.
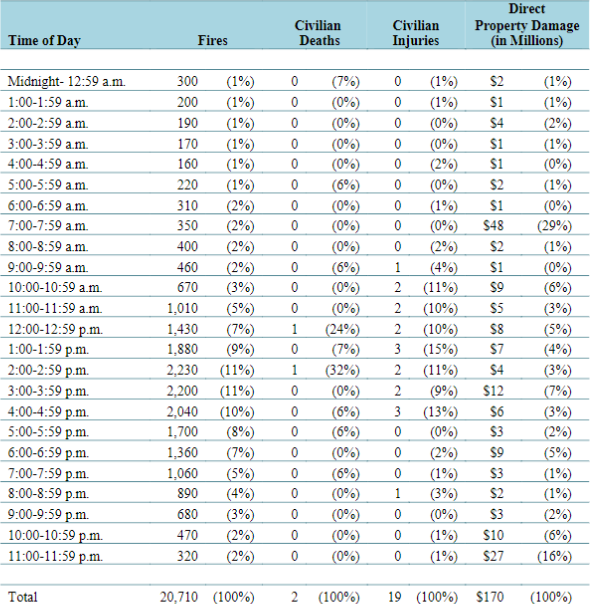
Table 23.
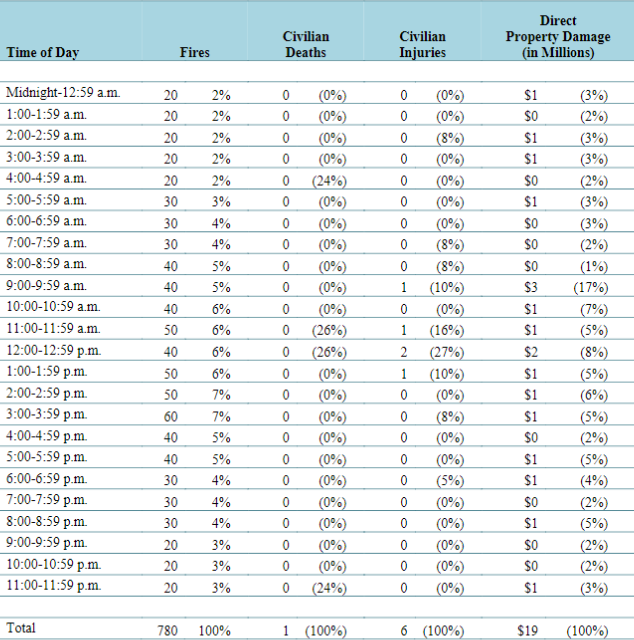
Vehicle Fires in Industrial PropertiesBy Time of Day, 2011-2015 Annual Averages
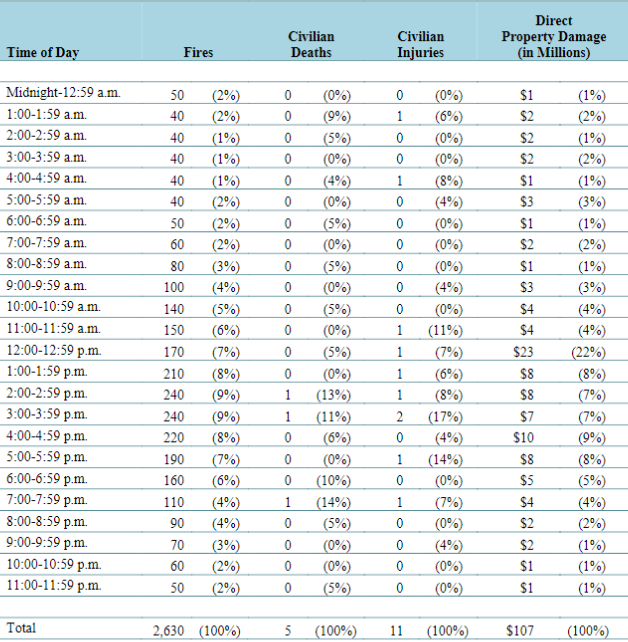
Note: Sums may not equal totals due to rounding errors. Fires are rounded to the nearest ten, civilian deaths and injuries to the nearest one, and direct property damage is rounded to the nearest million dollars.
Source: NFIRS 5.0 and NFPA Fire Experience Survey.
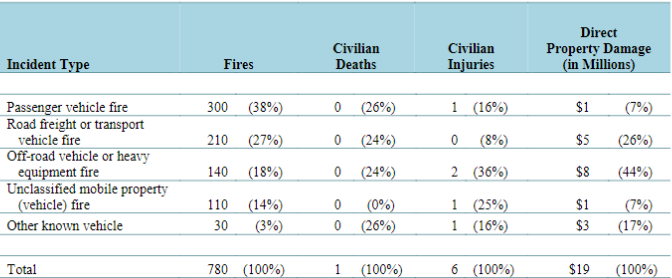
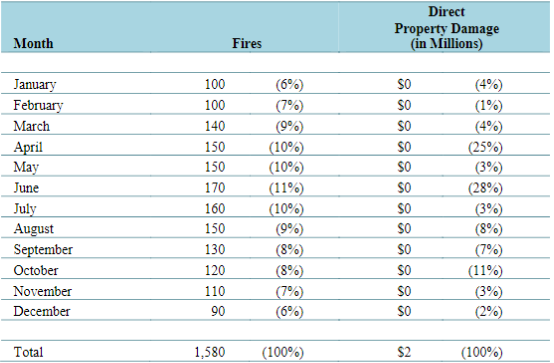
Table 24.
Vehicle Fires in Industrial PropertiesBy Incident Type, 2011-2015 Annual Averages
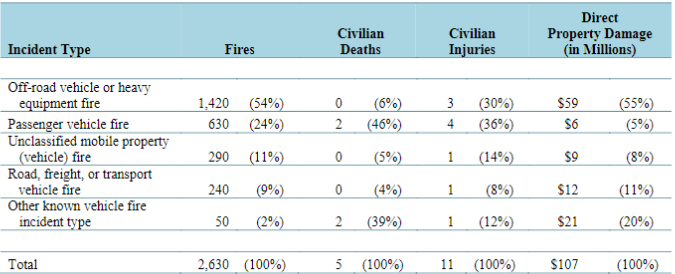
Note: Sums may not equal totals due to rounding errors. Fires are rounded to the nearest ten, civilian deaths and injuries to the nearest one, and direct property damage is rounded to the nearest million dollars. Source: NFIRS 5.0 and NFPA Fire Experience Survey.
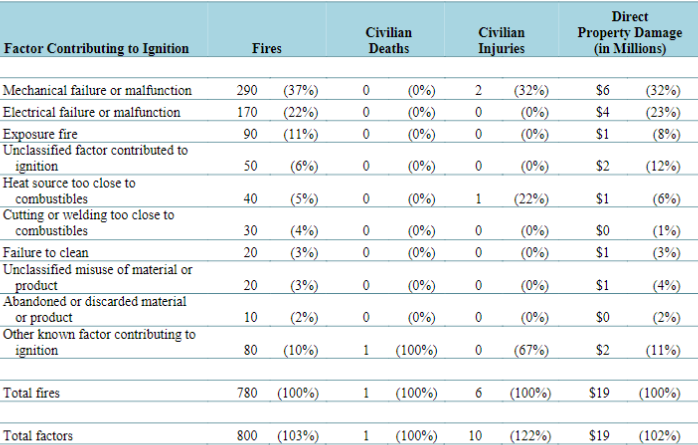
Table 25.
Vehicle Fires in Industrial PropertiesBy Factor Contributing to Ignition, 2011-2015 Annual Averages
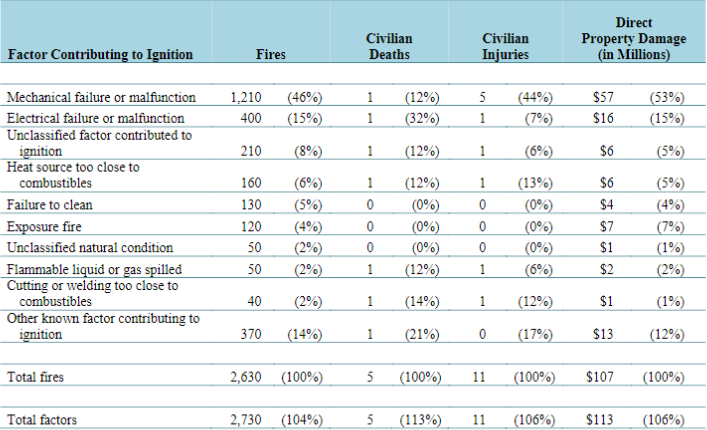
Note: Multiple entries are allowed which can result in sums higher than totals. Fires in which the factor contributing to ignition was coded as “none,” “unknown”, or “not reported” have been allocated proportionally among fires with known factor contributing to ignition. Sums may not equal totals due to rounding errors. Fires are rounded to the nearest ten, civilian deaths and injuries to the nearest one, and direct property damage is rounded to the nearest million dollars. See Appendix A for details.Source: NFIRS 5.0 and NFPA Fire Experience Survey.
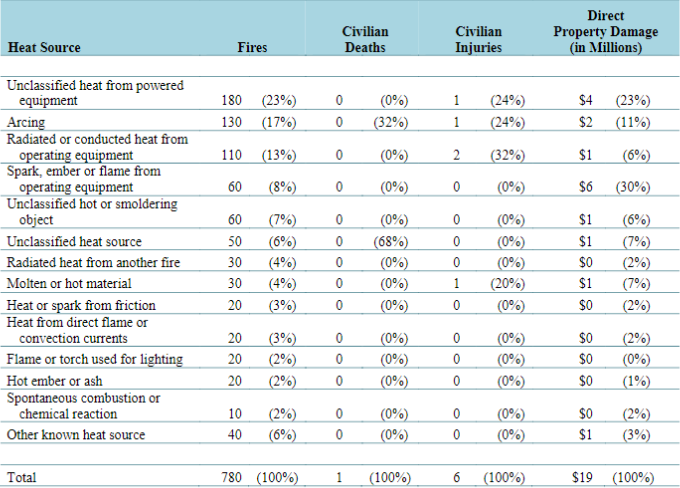
Table 26.
Vehicle Fires in Industrial PropertiesBy Heat Source, 2011-2015 Annual Averages
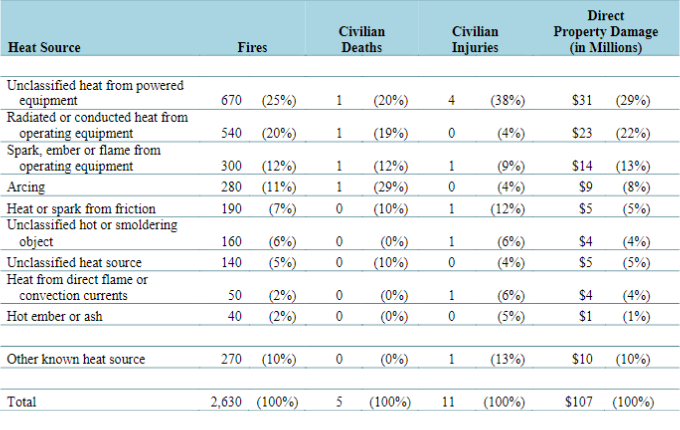
Note: Sums may not equal totals due to rounding errors. Fires are rounded to the nearest ten, civilian deaths and injuries to the nearest one, and direct property damage is rounded to the nearest million dollars. Source: NFIRS 5.0 and NFPA Fire Experience Survey.
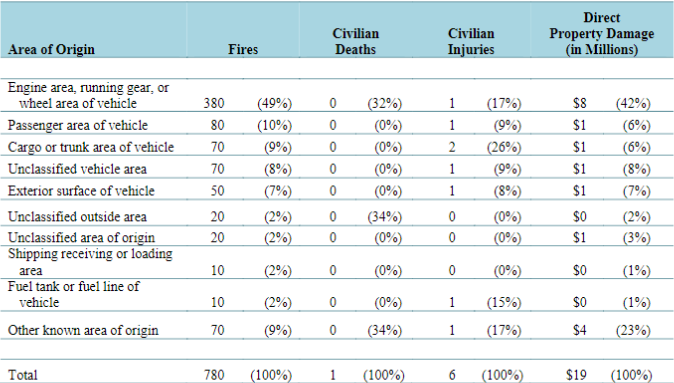
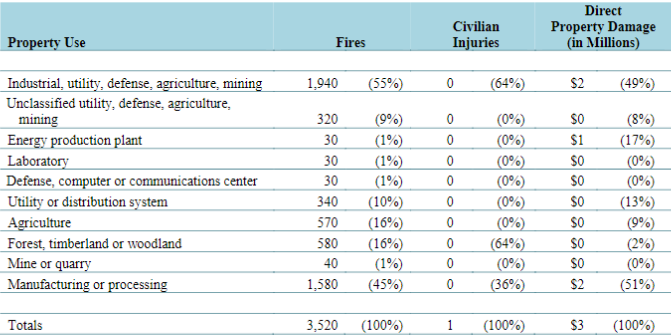
Table 27.
Vehicle Fires in Industrial PropertiesBy Area of Origin, 2011-2015 Annual Averages
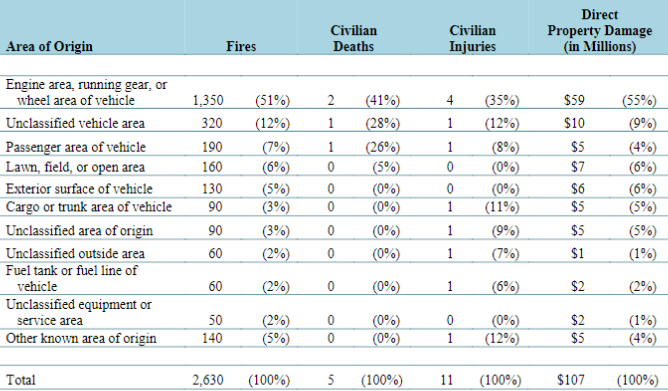
Note: Sums may not equal totals due to rounding errors. Fires are rounded to the nearest ten, civilian deaths and injuries to the nearest one, and direct property damage is rounded to the nearest million dollars. Source: NFIRS 5.0 and NFPA Fire Experience Survey.
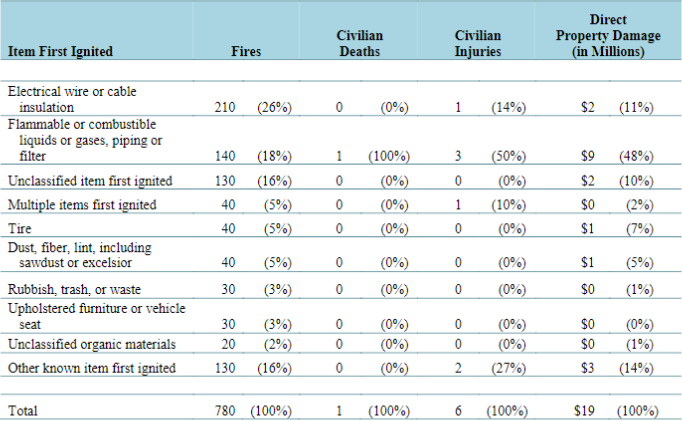
Table 28.
Vehicle Fires in Industrial PropertiesBy Item First Ignited, 2011-2015 Annual Averages
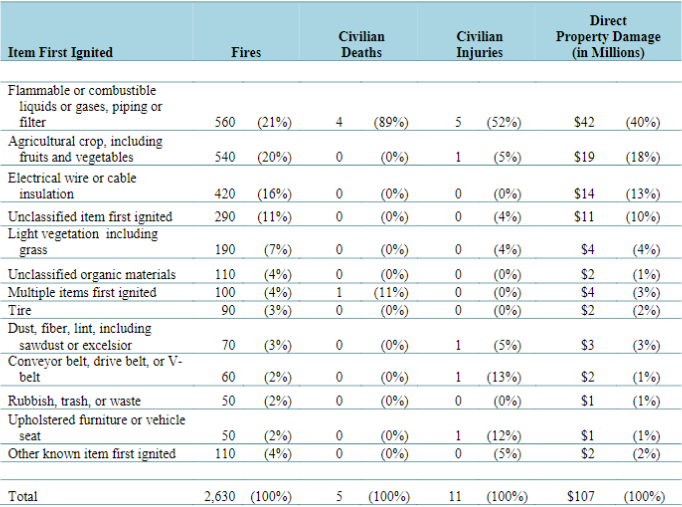
Note: Sums may not equal totals due to rounding errors. Fires are rounded to the nearest ten, civilian deaths and injuries to the nearest one, and direct property damage is rounded to the nearest million dollars. Source: NFIRS 5.0 and NFPA Fire Experience Survey.
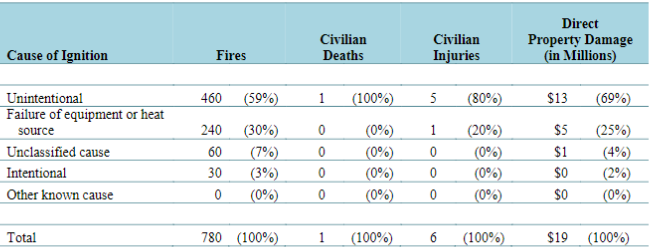
Table 29.
Vehicle F ires in Industrial PropertiesBy Cause of Ignition, 2011-2015 Annual Averages
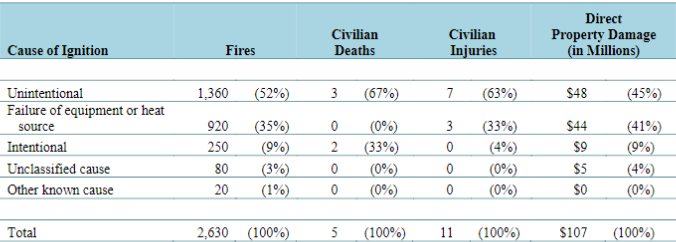
Note: Sums may not equal totals due to rounding errors. Confined structure fires other than chimney or flue fires (NFIRS incident type 113, and 115-118) were analyzed separately from non-confined structure fires (incident type 110-129, except 113-118). See Appendix A for details.Source: NFIRS 5.0 and NFPA Fire Experience Survey.
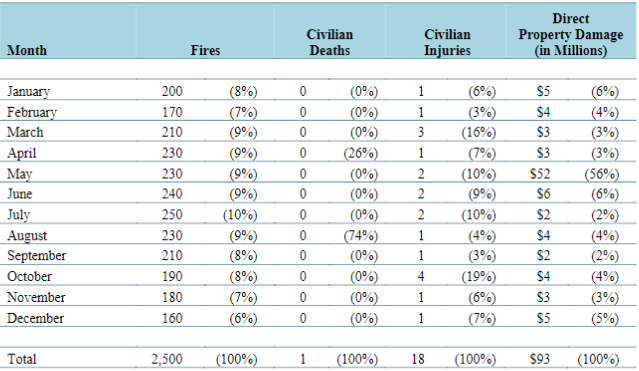
Table 30.
Vehicle Fires in Manufacturing Properties, by Month 2011-2015 Annual Average
Note: Sums may not equal totals due to rounding errors. Fires are rounded to the nearest ten, civilian deaths and injuries to the nearest one, and direct property damage is rounded to the nearest million dollars. Source: NFIRS 5.0 and NFPA Fire Experience Survey.
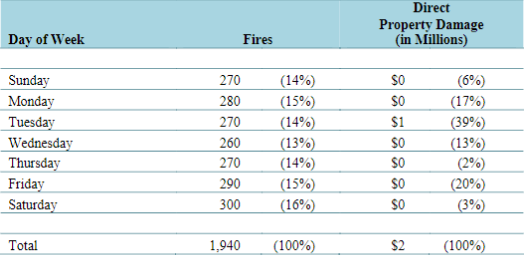
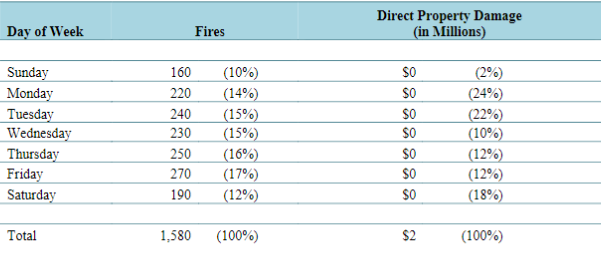
Table 31.
Vehicle Fires in Manufacturing Properties, by Day of Week 2011-2015 Annual Averages
Note: Sums may not equal totals due to rounding errors. Fires are rounded to the nearest ten, civilian deaths and injuries to the nearest one, and direct property damage is rounded to the nearest million dollars. Source: NFIRS 5.0 and NFPA Fire Experience Survey.
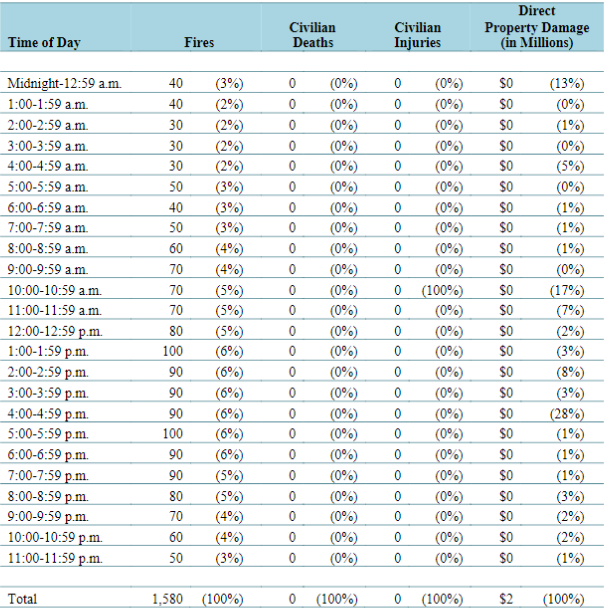
Table 32.
Vehicle Fires in Manufacturing Properties, by Time of Day 2011-2015 Annual Averages
Note: Sums may not equal totals due to rounding errors. Fires are rounded to the nearest ten, civilian deaths and injuries to the nearest one, and direct property damage is rounded to the nearest million dollars. Source: NFIRS 5.0 and NFPA Fire Experience Survey.
Table 33.
Vehicle Fires in Manufacturing Properties, by Incident Type 2011-2015 Annual Averages
Note: Sums may not equal totals due to rounding errors. Fires are rounded to the nearest ten, civilian deaths and injuries to the nearest one, and direct property damage is rounded to the nearest million dollars. Source: NFIRS 5.0 and NFPA Fire Experience Survey.
Table 34.
Vehicle Fires in Manufacturing PropertiesBy Factor Contributing to Ignition, 2011-2015 Annual Averages
Note: Multiple entries are allowed which can result in sums higher than totals. F ires in which the factor contributing to ignition was coded as “none,” “unknown,” or “not reported” have been allocated proportionally among fires with known factor contributing to ignition. Sums may not equal totals due to rounding errors. Fires are rounded to the nearest ten, civilian deaths and injuries to the nearest one, and direct property damage is rounded to the nearest million dollars. See Appendix A for details.Source: NFIRS 5.0 and NFPA Fire Experience Survey.
Table 35.
Vehicle Fires in Manufacturing PropertiesBy Heat Source, 2011-2015 Annual Averages
Note: Sums may not equal totals due to rounding errors. Fires are rounded to the nearest ten, civilian deaths and injuries to the nearest one, and direct property damage is rounded to the nearest million dollars. Source: NFIRS 5.0 and NFPA Fire Experience Survey.
Table 36.
Vehicle Fires in Manufacturing PropertiesBy Area of Origin, 2011-2015 Annual Averages
Note: Sums may not equal totals due to rounding errors. Fires are rounded to the nearest ten, civilian deaths and injuries to the nearest one, and direct property damage is rounded to the nearest million dollars. Source: NFIRS 5.0 and NFPA Fire Experience Survey.
Table 37.
Vehicle Fires in Manufacturing PropertiesBy Item First Ignited, 2011-2015 Annual Averages
Note: Sums may not equal totals due to rounding errors. Fires are rounded to the nearest ten, civilian deaths and injuries to the nearest one, and direct property damage is rounded to the nearest million dollars.
Source: NFIRS 5.0 and NFPA Fire Experience Survey.
Table 38.
Vehicle Fires in Manufacturing FacilitiesBy Cause of Ignition, 2011-2015 Annual Averages
Note: Sums may not equal totals due to rounding errors. Confined structure fires other than chimney or flue fires (NFIRS incident type 113, and 115-118) were analyzed separately from non-confined structure fires (incident type 110-129, except 113-118). See Appendix A for details.Source: NFIRS 5.0 and NFPA Fire Experience Survey.
Table 39.
Outside Trash and Rubbish Fires in Industrial and Manufacturing PropertiesBy Property Use, 2011-2015 Annual Averages
Note: Sums may not equal totals due to rounding errors. Fires are rounded to the nearest ten, civilian deaths and injuries to the nearest one, and direct property damage is rounded to the nearest million dollars. Source: NFIRS 5.0 and NFPA Fire Experience Survey.
Table 40.
Non-Trash Outside and Unclassified Fires in Industrial and Manufacturing PropertiesBy Property Use, 2011-2015 Annual Averages
Note: Sums may not equal totals due to rounding errors. Fires are rounded to the nearest ten, civilian deaths and injuries to the nearest one, and direct property damage is rounded to the nearest million dollars. Source: NFIRS 5.0 and NFPA Fire Experience Survey.
Table 41.
Outside Trash and Rubbish Fires in Industrial PropertiesBy Month, 2011-2015 Annual Averages
Note: Sums may not equal totals due to rounding errors. Fires are rounded to the nearest ten, civilian deaths and injuries to the nearest one, and direct property damage is rounded to the nearest million dollars. Source: NFIRS 5.0 and NFPA Fire Experience Survey.
Table 42.
Non-Trash and Unclassified Fires in Industrial PropertiesBy Month, 2011-2015 Annual Averages
Note: Sums may not equal totals due to rounding errors. Fires are rounded to the nearest ten, civilian deaths and injuries to the nearest one, and direct property damage is rounded to the nearest million dollars. Source: NFIRS 5.0 and NFPA Fire Experience Survey.
Table 43.
Outside Trash and Rubbish Fires in Manufacturing PropertiesBy Month, 2011-2015 Annual Averages
Note: Sums may not equal totals due to rounding errors. Fires are rounded to the nearest ten, civilian deaths and injuries to the nearest one, and direct property damage is rounded to the nearest million dollars.Source: NFIRS 5.0 and NFPA Fire Experience Survey.
Table 44.
Non-Trash Outside and Unclassified Fires in Manufacturing PropertiesBy Month, 2011-1015 Annual Averages
Note: Sums may not equal totals due to rounding errors. Fires are rounded to the nearest ten, civilian deaths and injuries to the nearest one, and direct property damage is rounded to the nearest million dollars. Source: NFIRS 5.0 and NFPA Fire Experience Survey.
Table 45.
Outside Trash and Rubbish Fires in Industrial PropertiesBy Day, 2011-2015 Annual Averages
Note: Sums may not equal totals due to rounding errors. Fires are rounded to the nearest ten, civilian deaths and injuries to the nearest one, and direct property damage is rounded to the nearest million dollars. Source: NFIRS 5.0 and NFPA Fire Experience Survey.
Table 45A.
Non-Trash Outside and Unclassified Fires in Industrial PropertiesBy Day, 2011-2015 Annual Averages
Note: Sums may not equal totals due to rounding errors. Fires are rounded to the nearest ten, civilian deaths and injuries to the nearest one, and direct property damage is rounded to the nearest million dollars. Source: NFIRS 5.0 and NFPA Fire Experience Survey.
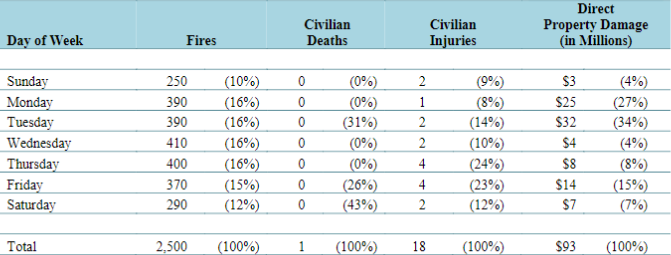
Table 46.
Outside Trash and Rubbish Fires in Manufacturing PropertiesBy Day of Week, 2011-2015 Annual Averages
AveragesNote: Sums may not equal totals due to rounding errors. Fires are rounded to the nearest ten, civilian deaths and injuries to the nearest one, and direct property damage is rounded to the nearest million dollars. Source: NFIRS 5.0 and NFPA Fire Experience Survey.
Table 46A.
Non-Trash Outside and Unclassified Fires in Manufacturing PropertiesBy Day of Week, 2011-2015 Annual Averages
Note: Sums may not equal totals due to rounding errors. Fires are rounded to the nearest ten, civilian deaths and injuries to the nearest one, and direct property damage is rounded to the nearest million dollars.
Source: NFIRS 5.0 and NFPA Fire Experience Survey.
Table 47.
Outside Trash and Rubbish Fires in Industrial PropertiesBy Time of Day, 2011-2015 Annual Averages
Note: Sums may not equal totals due to rounding errors. Fires are rounded to the nearest ten, civilian deaths and injuries to the nearest one, and direct property damage is rounded to the nearest million dollars.
Source: NFIRS 5.0 and NFPA Fire Experience Survey.
Table 47A.
Non-Trash Outside and Unclassified Fires in Industrial PropertiesBy Time of Day, 2011-2015 Annual Average
Note: Sums may not equal totals due to rounding errors. Fires are rounded to the nearest ten, civilian deaths and injuries to the nearest one, and direct property damage is rounded to the nearest million dollars. Source: NFIRS 5.0 and NFPA Fire Experience Survey.
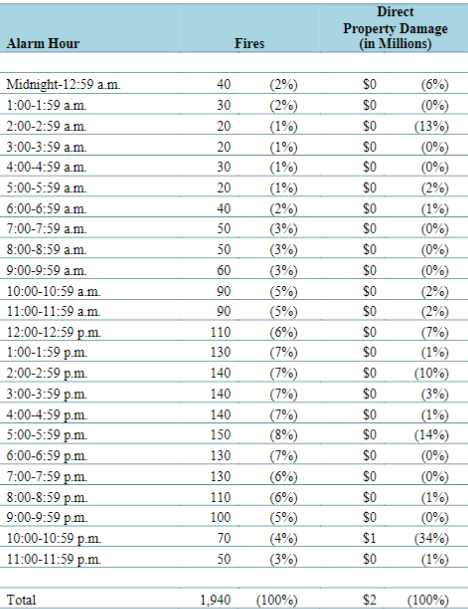
Table 48.
Outside Trash and Rubbish Fires in Manufacturing PropertiesBy Time of Day, 2011-2015 Annual Averages

Note: Sums may not equal totals due to rounding errors. Fires are rounded to the nearest ten, civilian deaths and injuries to the nearest one, and direct property damage is rounded to the nearest million dollars.
Source: NFIRS 5.0 and NFPA Fire Experience Survey.
Table 48A.
Non-Trash Outside and Unclassified Fires in Manufacturing PropertiesBy Time of Day, 2011-20115 Annual Averages
Note: Sums may not equal totals due to rounding errors. Fires are rounded to the nearest ten, civilian deaths and injuries to the nearest one, and direct property damage is rounded to the nearest million dollars. Source: NFIRS 5.0 and NFPA Fire Experience Survey.
Table 49.
Outside Trash and Rubbish Fires in Industrial PropertiesBy Leading Cause, 2011-2015 Annual Averages
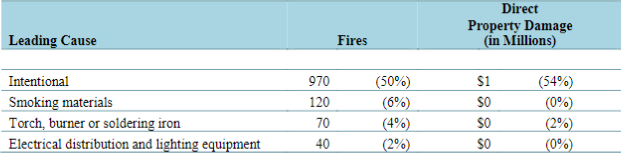
Note: Fires are rounded to the nearest ten, civilian deaths and injuries to the nearest one, and direct property damage is rounded to the nearest million dollars.
Source: NFIRS 5.0 and NFPA Fire Experience Survey.
Table 49A.
Non-Trash Outside and Unclassified Fires in Industrial PropertiesBy Leading Cause, 2011-2015 Annual Averages
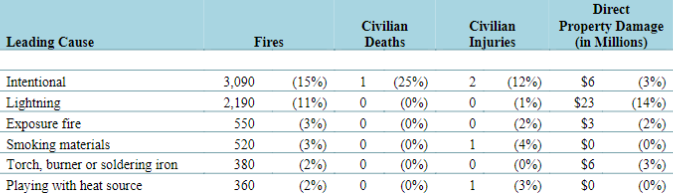
Note: Fires are rounded to the nearest ten, civilian deaths and injuries to the nearest one, and direct property damage is rounded to the nearest million dollars.
Source: NFIRS 5.0 and NFPA Fire Experience Survey.
Table 50.
Outside Trash and Rubbish Fires in Industrial PropertiesBy Factor Contributing to Ignition, 2011-2015 Annual Averages
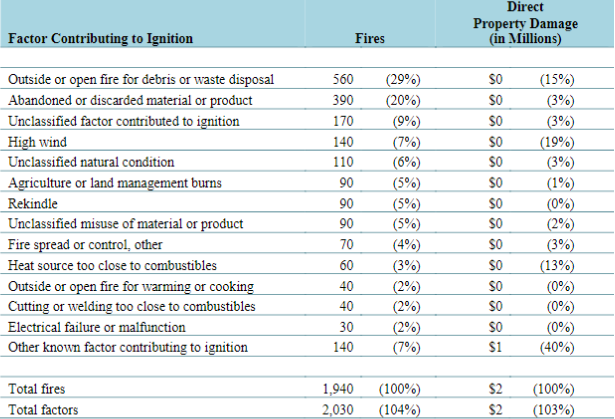
Note: Sums may not equal totals due to rounding errors. Fires are rounded to the nearest ten, civilian deaths and injuries to the nearest one, and direct property damage is rounded to the nearest million dollars. Source: NFIRS 5.0 and NFPA Fire Experience Survey.
Table 50A.
Non-Trash Outside and Unclassified Fires in Industrial PropertiesBy Factor Contributing to Ignition, 2011-2015 Annual Averages
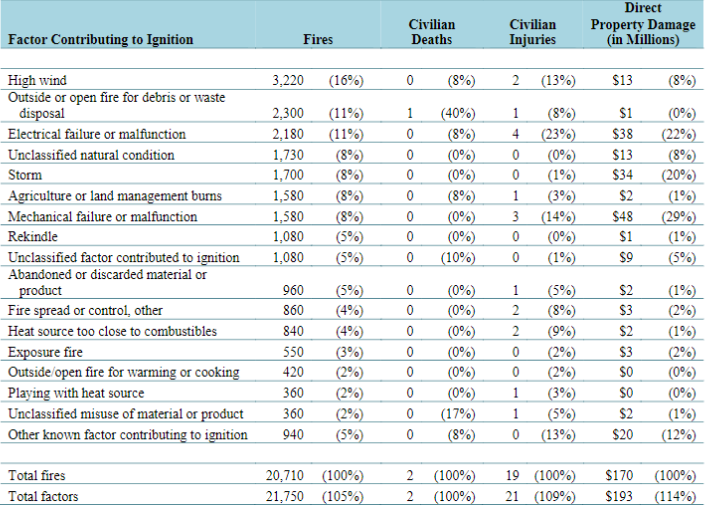
Note: Sums may not equal totals due to rounding errors. Fires are rounded to the nearest ten, civilian deaths and injuries to the nearest one, and direct property damage is rounded to the nearest million dollars. Source: NFIRS 5.0 and NFPA Fire Experience Survey.
to be continued...
Source: https://www.nfpa.org/
Registered
4
Average
daily search
70%
Effective
search
231
Registered
companies
You are using BETA version.
Send feedback