

6359
FIRES IN INDUSTRIAL AND MANUFACTURING PROPERTIES - PART 3
06/26/2018
Investigation Reports: In-depth analysis of major fires in industrial and manufacturing properties. www.nfpa.org/investigations
Fire Protection Handbook: NFPA’s Fire Protection Handbook has a full chapter on fire protection in industrial occupancies.
Codes & Standards: Many NFPA codes and standards relate to industrial or manufacturing facilities, including:
•NFPA 30: Flammable and Combustible Liquids Code - www.nfpa.org/30
•NFPA 61: Standard for the Prevention of Fires and Dust Explosions in Agricultural and Food Processing Facilities - www.nfpa.org/61
•NFPA 101: Life Safety Code® - www.nfpa.org/101
•NFPA 654: Standard for the Prevention of Fire and Dust Explosions from the Manufacturing, Processing, and Handling of Combustible Particulate Solids -www.nfpa.org/654
•NFPA 664: Standard for the Prevention of Fires and Explosions in Wood Processing and Woodworking Facilities - www.nfpa.org/664•NFPA 5000: Building Construction and Safety Code® - www.nfpa.org/5000
Table 1A.
Fires in Industrial or Manufacturing Properties,
By Year 1980- 2015
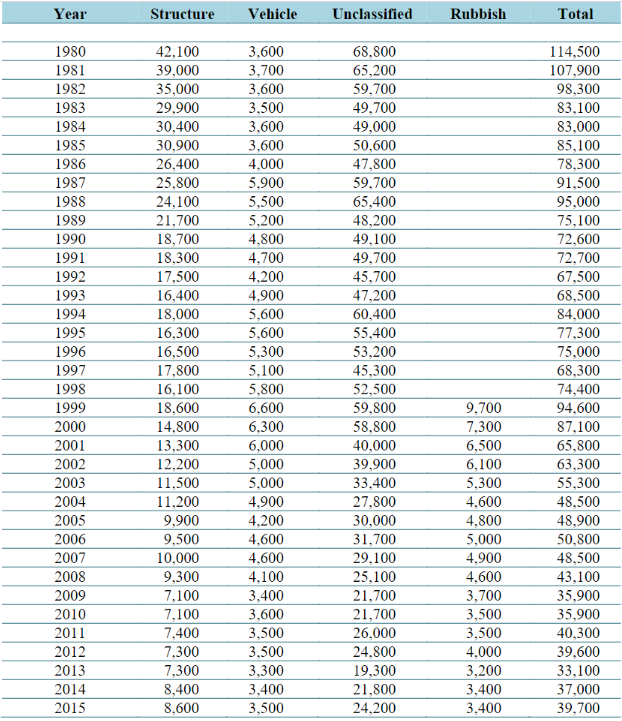
Note: These are national estimates of fires reported to U.S. fire departments and so exclude fires reported only to federal or state agencies or industries fire brigades. Fires are rounded to the nearest 100. Because of low participation in NFIRS Version 5.0 during 1999-2001, estimates for those years must be used with caution.
Unknowns have been allocated proportionally.
Source: NFIRS and NFPA Fire Experience Survey.
Table 1B.
Civilian Fire Deaths in Industrial or Manufacturing Properties
By Year 1980-2015
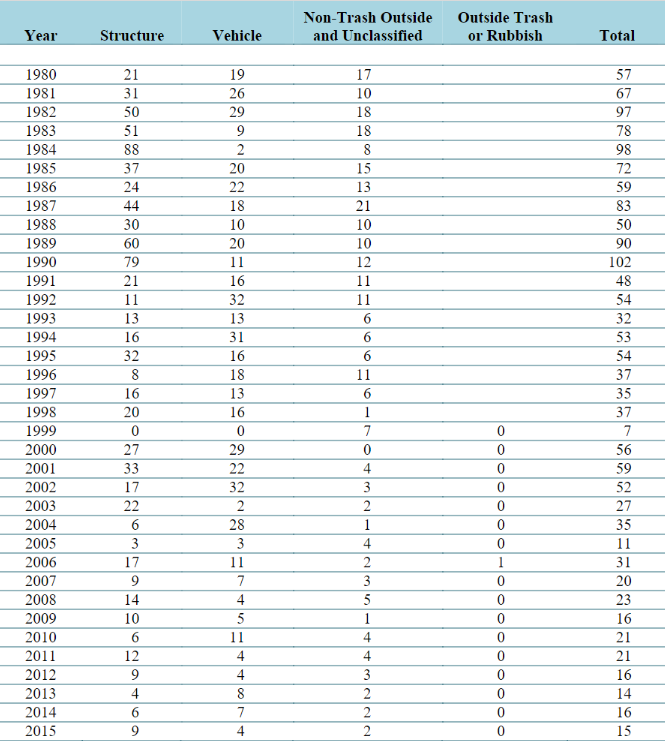
Note: National estimates are projections. Casualty projections can be heavily influenced by the inclusion or exclusion of a small number of unusually serious fires. Because of low participation in NFIRS Version 5.0 during 1999-2001, estimates for those years must be used with caution. Deaths have been rounded to the nearest one. Unknowns have been allocated proportionally. Source: NFIRS and NFPA Fire Experience Survey.
Table 1C.
Civilian Injuries in Industrial or Manufacturing Properties,
By Year 1980-2015
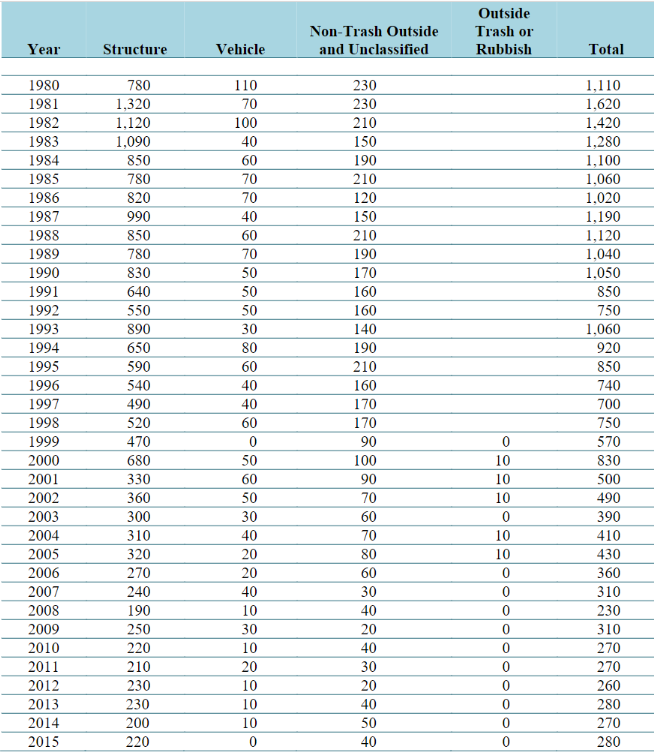
Note: National estimates are projections. Casualty projections can be heavily influenced by the inclusion or exclusion of a small number of unusually serious fires. Because of low participation in NFIRS Version 5.0 during 1999-
2001, estimates for those years must be used with caution. Injuries have been rounded to the nearest ten. Unknowns have been allocated proportionally.
Source: NFIRS and NFPA Fire Experience Survey.
2001, estimates for those years must be used with caution. Injuries have been rounded to the nearest ten. Unknowns have been allocated proportionally.
Source: NFIRS and NFPA Fire Experience Survey.
Table 1D.
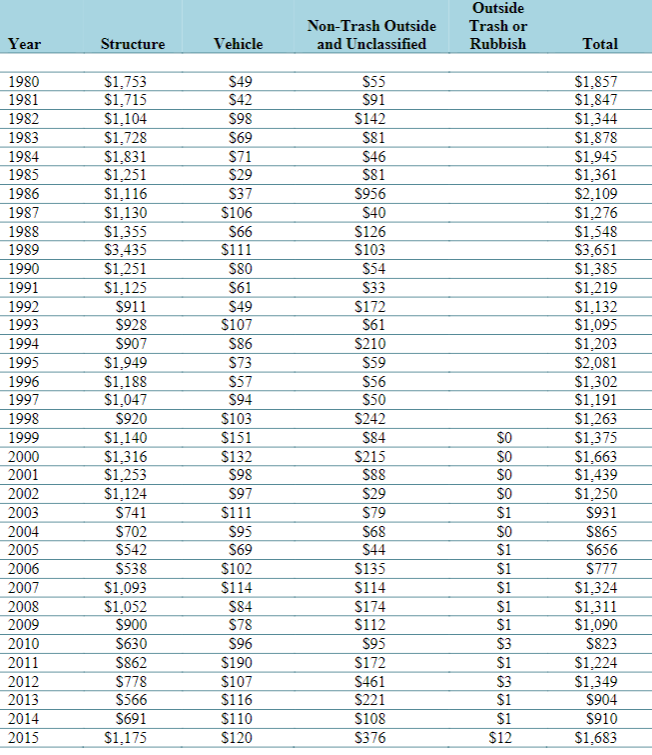
Direct Property Damage (in Millions) in Industrial or Manufacturing Properties By Year (as Reported) 1980-2015
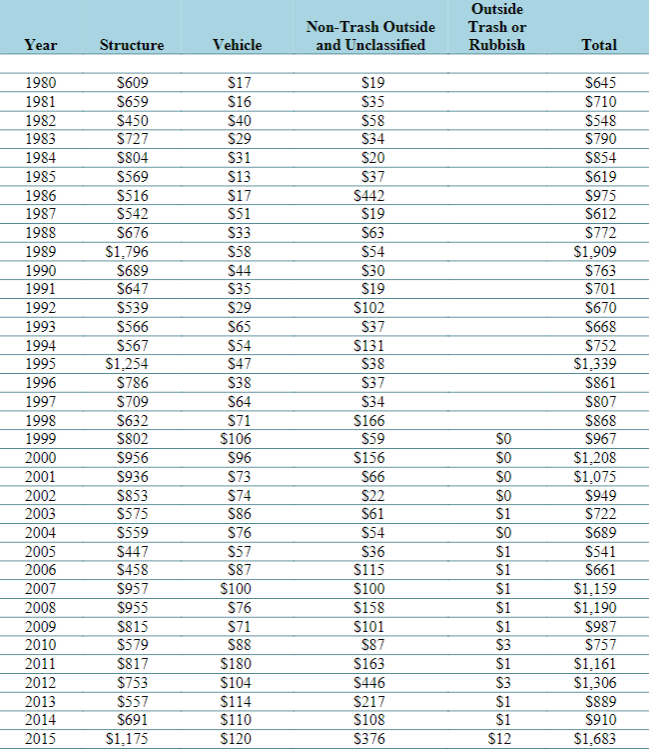
Note: National estimates are projections. Casualty projections can be heavily influenced by the inclusion or exclusion of a small number of unusually serious fires. Because of low participation in NFIRS Version 5.0 during 1999 -2001, estimates for those years must be used with caution. Dollar losses have been rounded to the nearest million. Unknowns have been allocated proportionally.
Source: NFIRS and NFPA Fire Experience Survey.
Table 1E.
Direct Property Damage (in Millions) in Industrial or Manufacturing Properties
By Year, 1980-2015 (in 2015 dollars)
Note: National estimates are projections. Casualty projections can be heavily influenced by the inclusion or exclusion of a small number of unusually serious fires. Because of low participation in NFIRS Version 5.0 during
1999-2001, estimates for those years must be used with caution. Dollar losses have been rounded to the nearest million dollars. Inflation adjustment to 2015 dollars is done using the consumer price index. Unknowns have been allocated proportionally.
Source: NFIRS and NFPA Fire Experience Survey.
Table 2.
Structure Fires in Industrial and Manu facturing Properties By Month, 2011-2015
Annual Averages
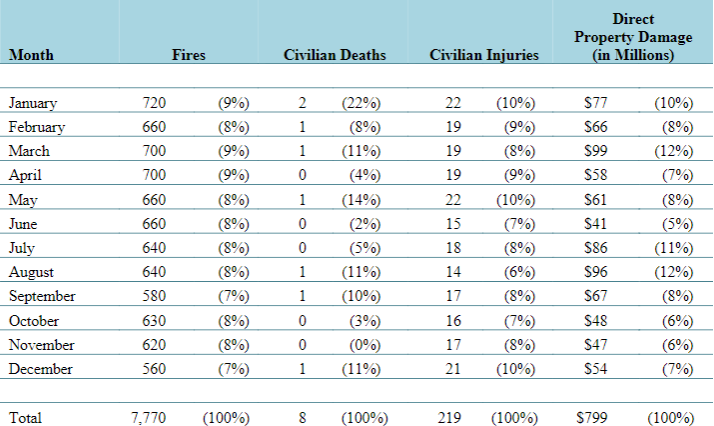
Note: Sums may not equal totals due to rounding errors. Fires are rounded to the nearest ten, civilian deaths and injuries to
the nearest one, and direct property damage is rounded to the nearest million dollars.
Source: NFIRS and NFPA Fire Experience Survey.
Table 3.
Structure Fires in Industrial and Manufacturing
Properties By Day of Week, 2011-2015
Annual Averages
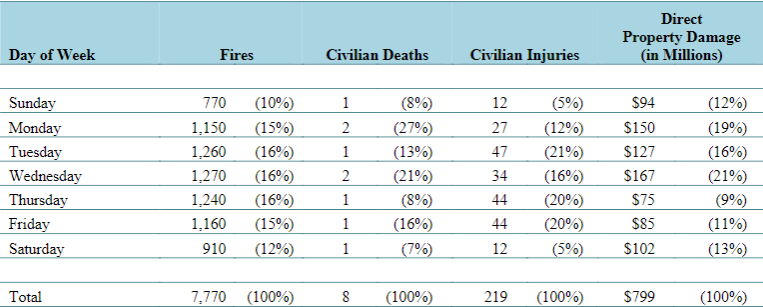
Note: Sums may not equal totals due to rounding errors. Fires are rounded to the nearest ten, civilian deaths and injuries to the nearest one, and direct property damage is rounded to the nearest million dollars. Source: NFIRS and NFPA Fire Experience Survey.
Table 4.
Structure Fires in Industrial and Manufacturing PropertiesBy Time of Day, 2011-2015 Annual Averages
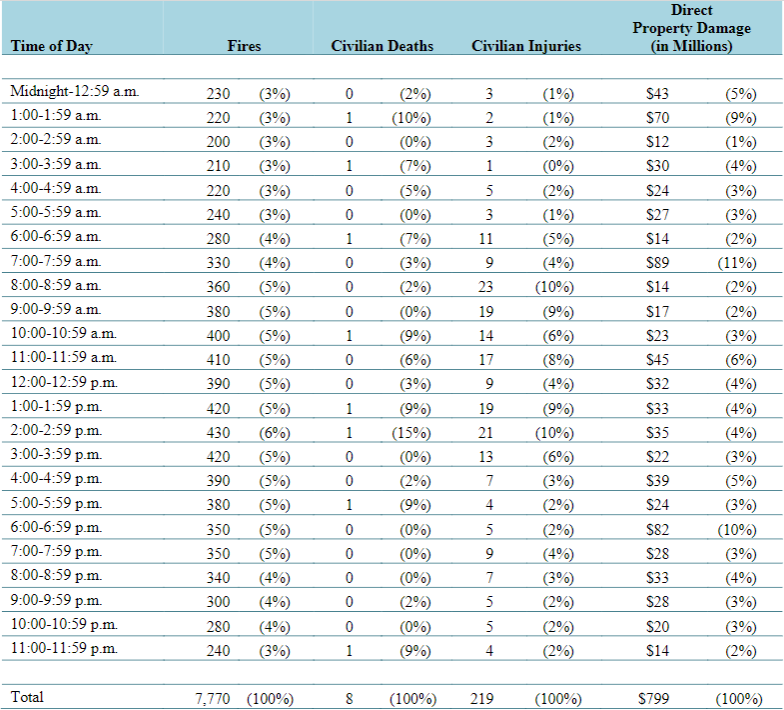
Note: Sums may not equal totals due to rounding errors. Fires are rounded to the nearest ten, civilian deaths and injuries to the nearest one, and direct property damage is rounded to the nearest million dollars. Source: NFIRS and NFPA Fire Experience Survey.
Table 5.
Structure Fires in Industrial PropertiesBy Leading Cause, 2011-2015 Annual Averages
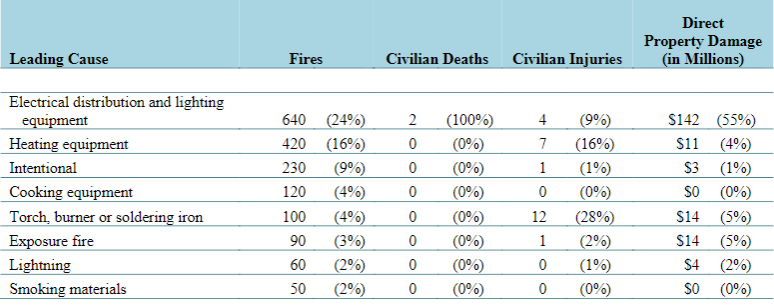
The causes in this table are drawn from multiple fields. The methodology used is described in Appendix B.
Source: NFIRS and NFPA Fire Experience survey.
Table 6.
Structure Fires in Industrial PropertiesBy Equipment Involved in Ignition, 2011-2015 Annual Averages
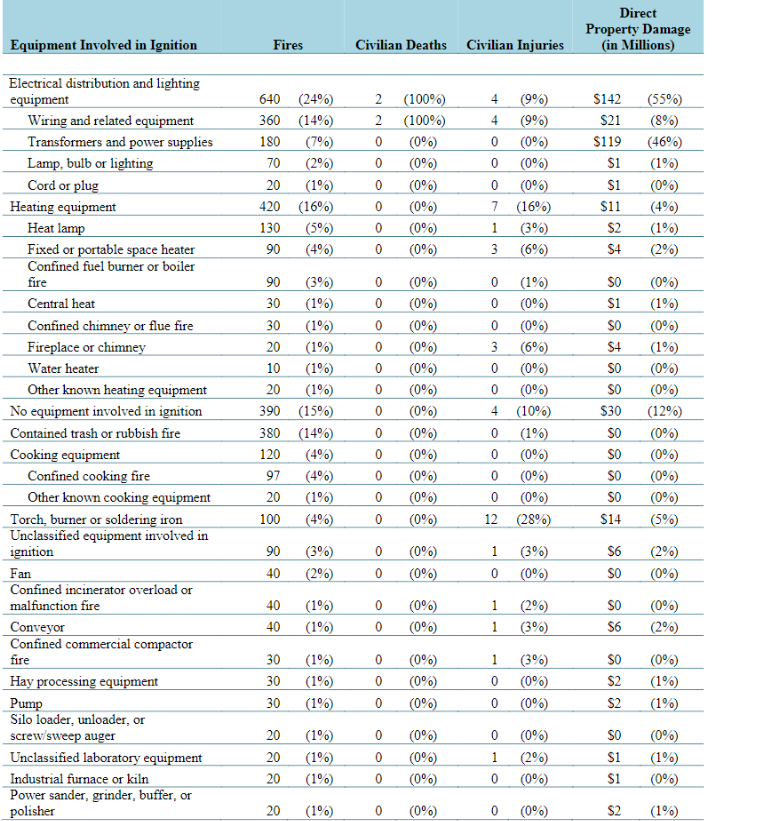
Table 6.
Structure Fires in Industrial PropertiesBy Equipment Involved in Ignition, 2011-2015 Annual Averages (Continued)
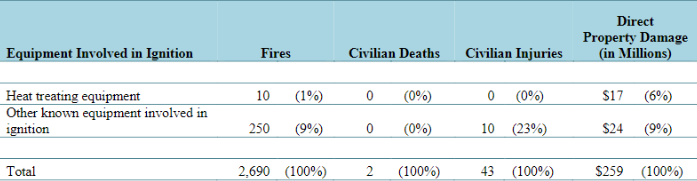
Note: Non-confined fires in which the equipment involved in ignition was unknown or not reported have been allocated proportionally among fires with known equipment involved. The same approach was used with confined cooking fires. Fires in which the equipment involved in ignition was entered as none but the heat source indicated equipment involvement or the heat source was unknown were also treated as unknown and allocated proportionally among fires with known equipment involved. Non-confined fires in which the equipment was partially unclassified (i.e., unclassified kitchen or cooking equipment, unclassified heating, cooling or air condition equipment, etc.) were allocated proportionally among fires in that grouping (kitchen or cooking equipment; heating, cooling or air conditioning equipment, etc.). The same approach was used with confined cooking fires. The estimates of fires involving fireplace or chimney include all fires with the confined chimney or flue incident type regardless of what may have been coded as equipment involved. Likewise, the estimates of fires involving furnaces, central heat or boilers include all fires with confined fuel burner or boiler incident type. The estimates shown should be considered upper bounds. Non-cooking confined fires were not analyzed separately. Estimates of other types of equipment exclude confined fires. Sums may not equal totals due to rounding errors. Fires are rounded to the nearest ten, civilian deaths and injuries to the nearest one, and direct property damage is rounded to the nearest million dollars. Source: NFIRS and NFPA Fire Experience Survey.
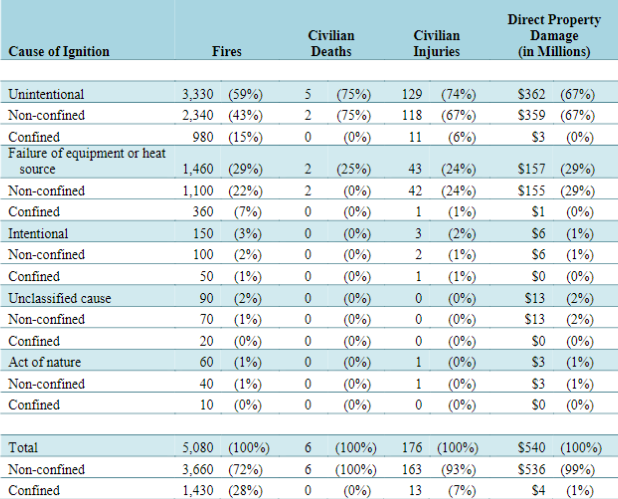
Table 7. Structure Fires in Industrial PropertiesBy Cause of Ignition, 2011-2015 Annual Averages
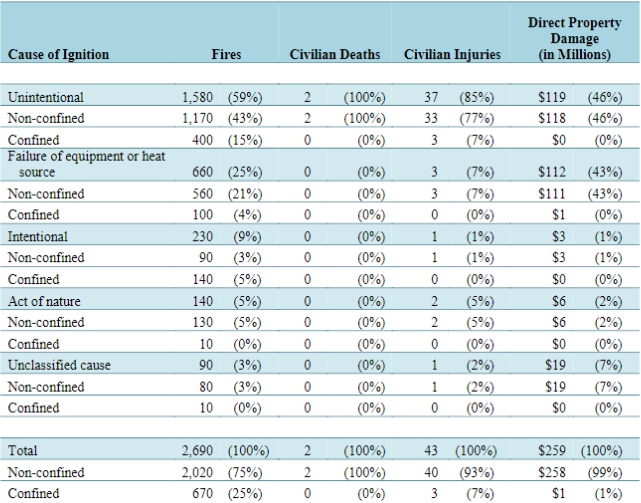
Note: Sums may not equal totals due to rounding errors. Confined structure fires other than chimney or flue fires (NFIRS incident type 113, and 115-118) were analyzed separately from non-confined structure fires (incident type 110-129, except 113-118). See Appendix A for details.Source: NFIRS 5.0 and NFPA Fire Experience Survey.
Table 8.
Structure Fires in Industrial PropertiesBy Factor Contributing to Ignition, 2011-2015 Annual Averages
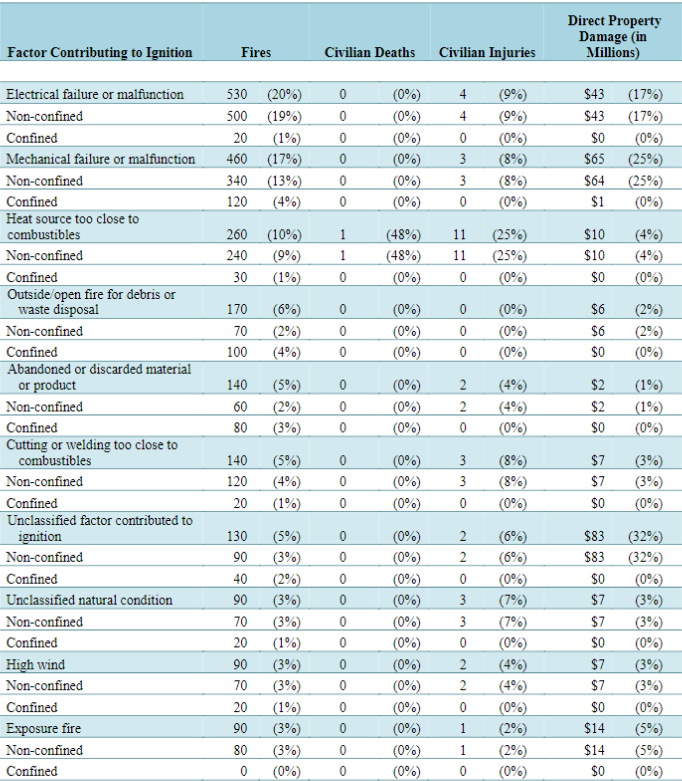
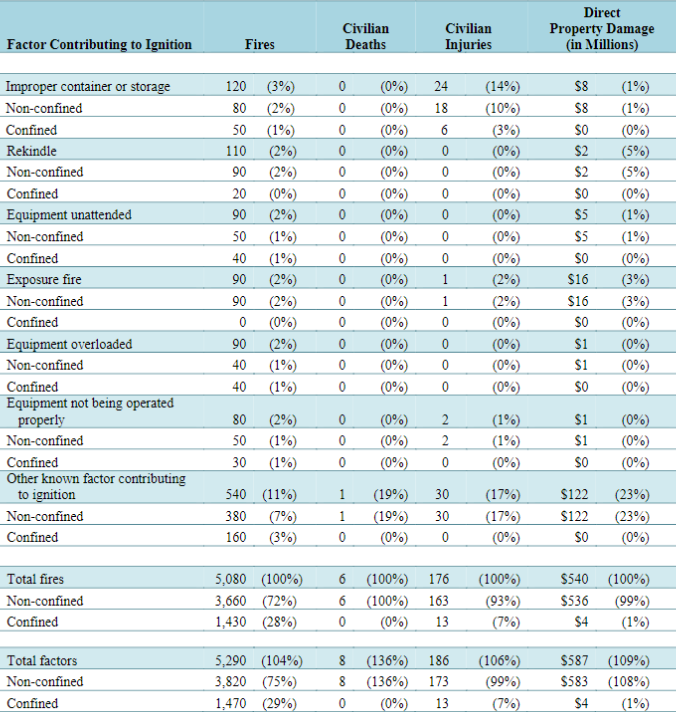
Table 8.
Structure Fires in Industrial PropertiesBy Factor Contributing to Ignition, 2011-2015 Annual Averages (Continued)
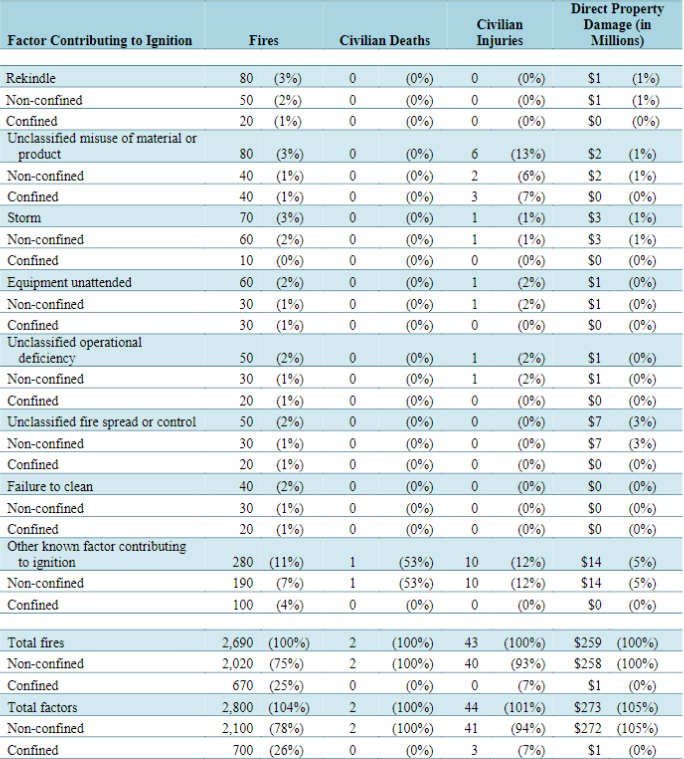
Note: Multiple entries are allowed which can result in sums higher than totals. Fires in which the factor contributing to ignition was coded as “none,” “unknown”, or “not reported” have been allocated proportionally among fires with known factor contributing to ignition. Confined structure fires (NFIRS incident type 113-118) were analyzed separately from non-confined structure fires (incident type 110-129, except 113-118). See Appendix A for details.Source: NFIRS 5.0 and NFPA Fire Experience Survey.
Table 9.
Structure Fires in Industrial PropertiesBy Heat Source, 2011-2015 Annual Averages
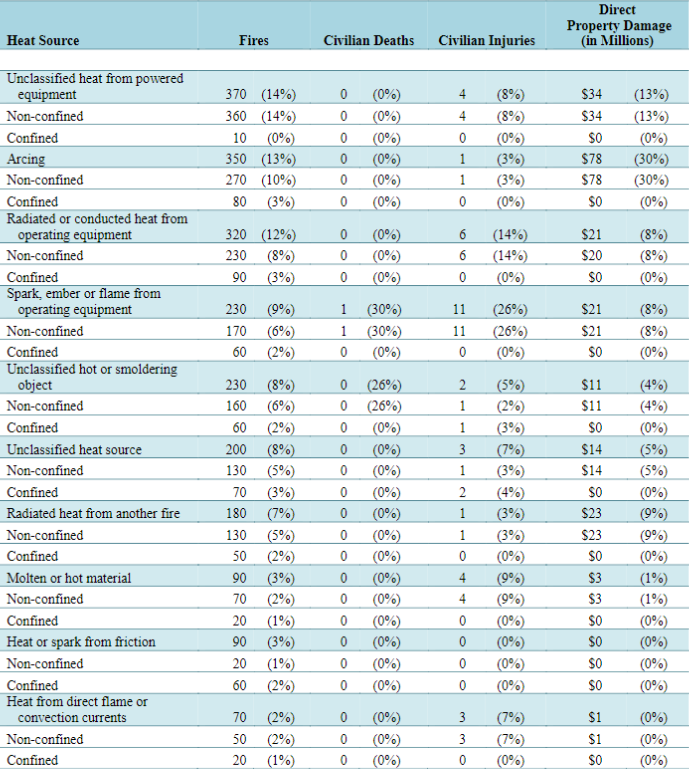
Table 9.
Structure Fires in Industrial PropertiesBy Heat Source, 2011-2015 Annual Averages (Continued)
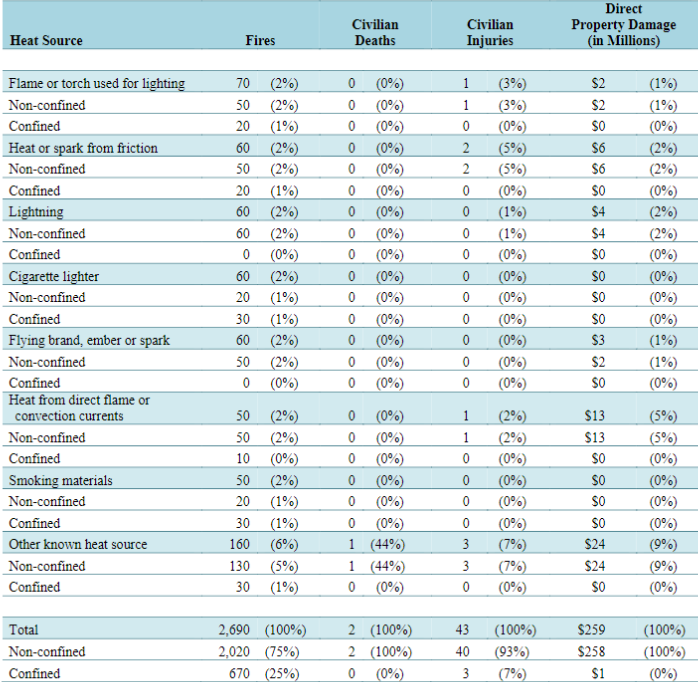
Note: Sums may not equal totals due to rounding errors. The statistics on matches, lighters, smoking materials and candles include a proportional share of fires in which the heat source was heat from an unclassified open flame or smoking material. Confined structure fires (NFIRS incident type 113-118) were analyzed separately from non-confined structure fires (incident type 110-129, except 113-118). See Appendix A for details.Source: NFIRS 5.0 and NFPA Fire Experience Survey.
Table 10.
Structure Fires in Industrial PropertiesBy Area of Origin, 2011-2015 Annual Averages
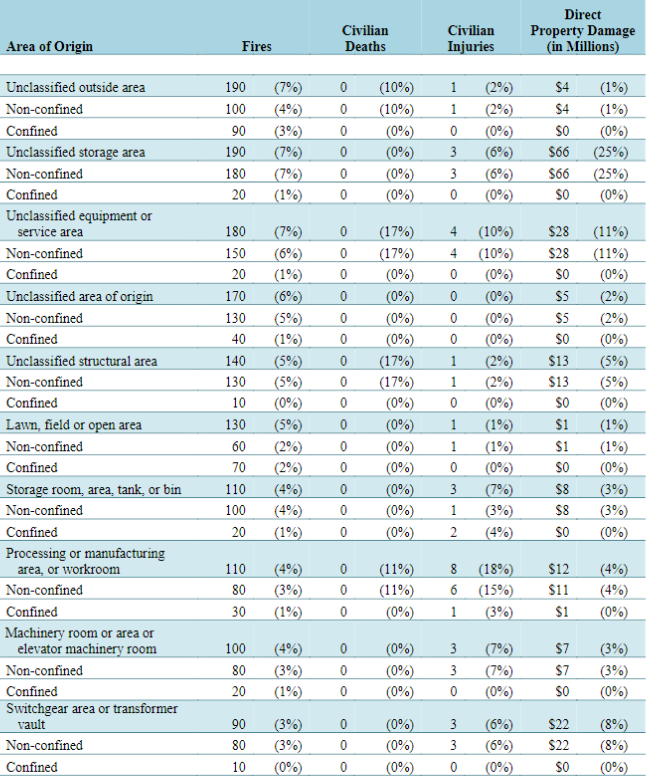
Table 10.
Structure Fires in Industrial PropertiesBy Area of Origin, 2011-2015 Annual Averages (Continued)
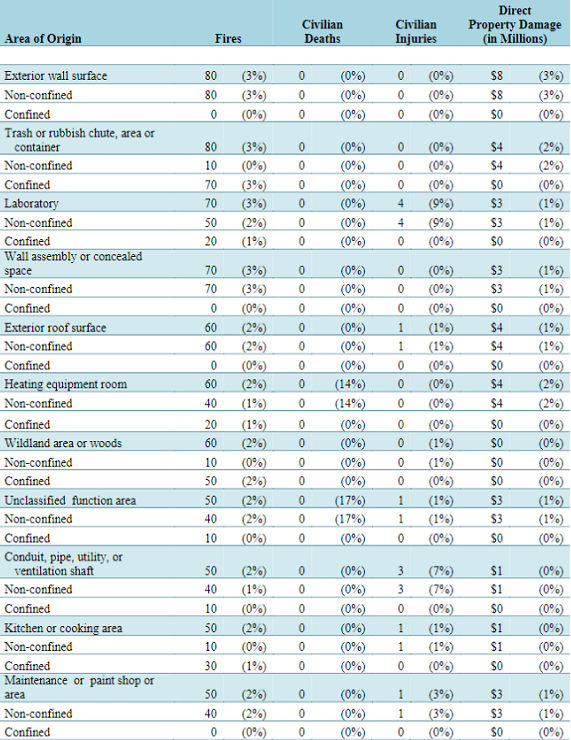
Table 10.
Structure Fires in Industrial PropertiesBy Area of Origin, 2011-2015 Annual Averages (Continued)
Note: Sums may not equal totals due to rounding errors. Confined structure fires other than chimney or flue fires (NFIRS incident type 113, and 115-118) were analyzed separately from non-confined structure fires (incident type 110-129, except 113-118). See Appendix A for details.Source: NFIRS 5.0 and NFPA Fire Experience Survey.
Table 11.
Structure Fires in Industrial Properties, By Item First Ignited, 2011-2015 Annual Averages
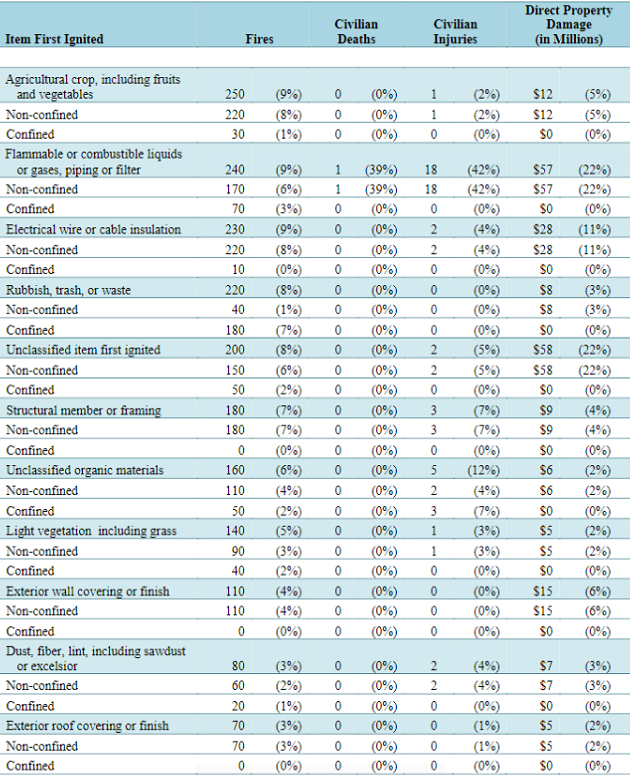
Table 11.
Structure Fires in Industrial PropertiesBy Item First Ignited, 2011-2015 Annual Averages (Continued)
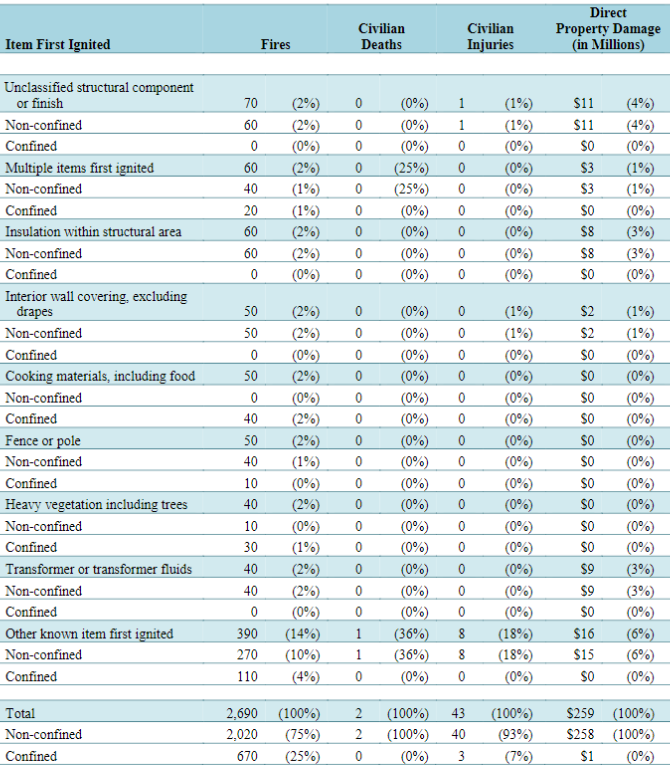
Note: Sums may not equal totals due to rounding errors. Confined structure fires (NFIRS incident type 113-118) were analyzed separately from non-confined structure fires (incident type 110-129, except 113-118). See Appendix A for details.Source: NFIRS 5.0 and NFPA Fire Experience Survey.
Table 12.
Structure Fires in Industrial PropertiesBy Extent of Flame Spread, 2011-2015 Annual Averages
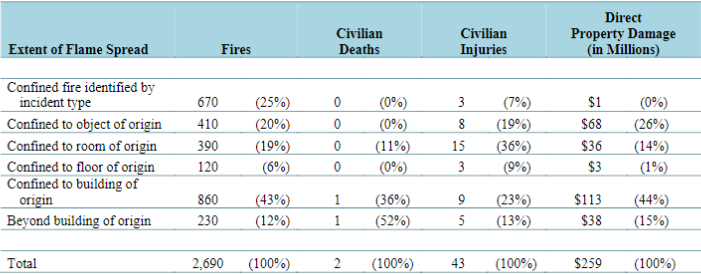
Note: Sums may not equal totals due to rounding errors. Source: NFIRS 5.0 and NFPA Fire Experience Survey.
Table 13.
Structure Fires in Manufacturing PropertiesBy Leading Cause, 2011-2015 Annual Averages

The causes in this table are drawn from multiple fields. The methodology used is described in Appendix B. Source: NFIRS and NFPA Fire Experience survey.
Table 14.
Structure Fires in Manufacturing Properties, by Equipment Involved in Ignition2011-2015 Annual Averages
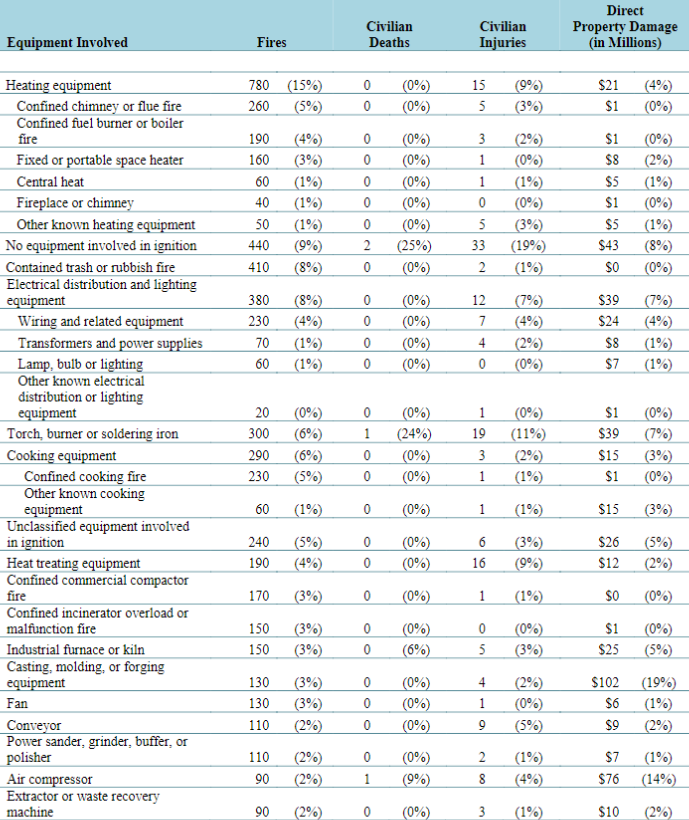
Table 14.
Structure Fires in Manufacturing Properties, by Equipment Involved in Ignition2011-2015 Annual Averages (Continued)
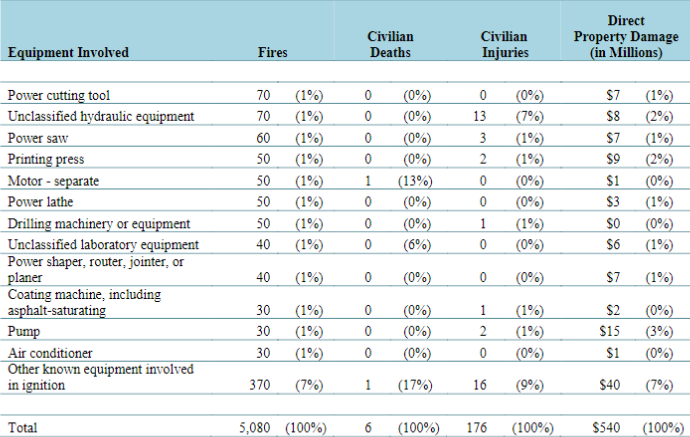
Note: Non-confined fires in which the equipment involved in ignition was unknown or not reported have been allocated proportionally among fires with known equipment involved. The same approach was used with confined cooking fires. Fires in which the equipment involved in ignition was entered as none but the heat source indicated equipment involvement or the heat source was unknown were also treated as unknown and allocated proportionally among fires with known equipment involved. Non-confined fires in which the equipment was partially unclassified (i.e., unclassified kitchen or cooking equipment, unclassified heating, cooling or air condition equipment, etc.) were allocated proportionally among fires in that grouping (kitchen or cooking equipment; heating, cooling or air conditioning equipment, etc.). The same approach was used with confined cooking fires. The estimates of fires involving fireplace or chimney include all fires with the confined chimney or flue incident type regardless of what may have been coded as equipment involved. Likewise, the estimates of fires involving furnaces, central heat or boilers include all fires with confined fuel burner or boiler incident type. The estimates shown should be considered upper bounds. Non-cooking confined fires were not analyzed separately. Estimates of other types of equipment exclude confined fires. Sums may not equal totals due to rounding errors. Fires are rounded to the nearest ten, civilian deaths and injuries to the nearest one, and direct property damage is rounded to the nearest million dollars. Source: NFIRS and NFPA Fire Experience Survey.
Table 15.
Structure Fires in Manufacturing Properties, by Cause of Ignition2011-2015 Annual Averages
Note: Sums may not equal totals due t o rounding errors. Confined structure fires other than chimney or f lue fires (NFIRS incident type 113, and 115-118) were analyzed separately from non-confined structure fires (incident type 110-129, except 113-118). See Appendix A for details. Source: NFIRS 5.0 and NFPA Fire Experience Survey.
Table 16.
Structure Fires in Manufacturing PropertiesBy Factor Contributing to Ignition, 2011-2015 Annual Averages
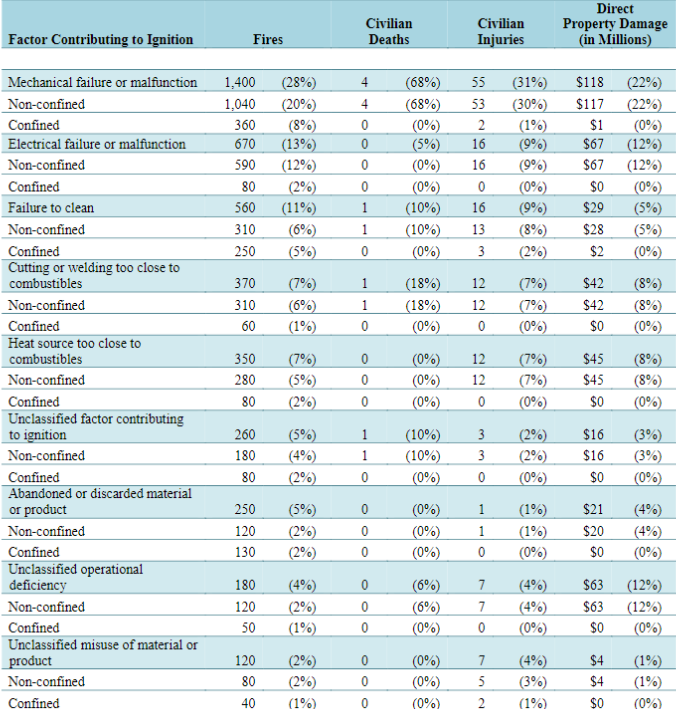
Table 16.
Structure Fires in Manufacturing PropertiesBy Factor Contributing to Ignition, 2011-2015 Annual Averages (Continued)
Note: Multiple entries are allowed which can result in sums higher than totals. Fires in which the factor contributing to ignition was coded as “none,” “unknown”, or “not reported” have been allocated proportionally among fires with known factor contributing to ignition. Confined structure fires (NFIRS incident type 113-118) were analyzed separately from non-confined structure fires (incident type 110-129, except 113-118). See Appendix A for details.Source: NFIRS 5.0 and NFPA Fire Experience Survey.
Table 17.
Structure Fires in Manufacturing PropertiesBy Heat Source, 2011-2015 Annual Averages
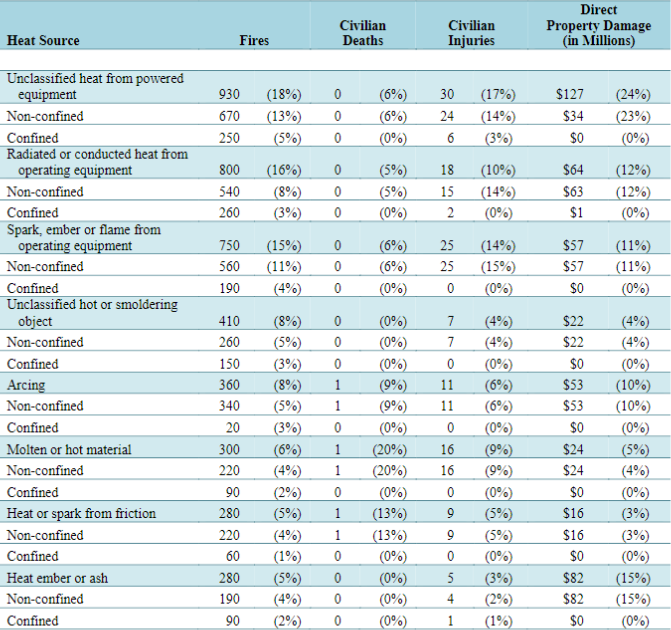
Table 17.
Structure Fires in Manufacturing PropertiesBy Heat Source, 2011-2015 Annual Averages (Continued)
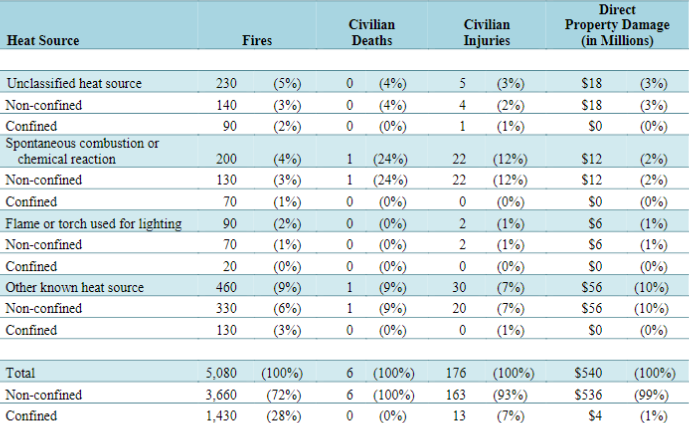
Note: Sums may not equal totals due to rounding errors. The statistics on matches, lighters, smoking materials and candles include a proportional share of fires in which the heat source was heat from an unclassified open flame or smoking material. Confined structure fires (NFIRS incident type 113-118) were analyzed separately from non-confined structure fires (incident type 110-129, except 113-118). See Appendix A for details.Source: NFIRS 5.0 and NFPA Fire Experience Survey.
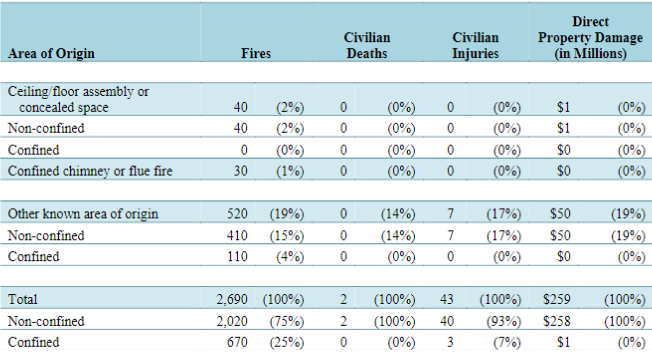
Table 18.
Structure Fires in Manufacturing PropertiesBy Area of Origin, 2011-2015 Annual Averages
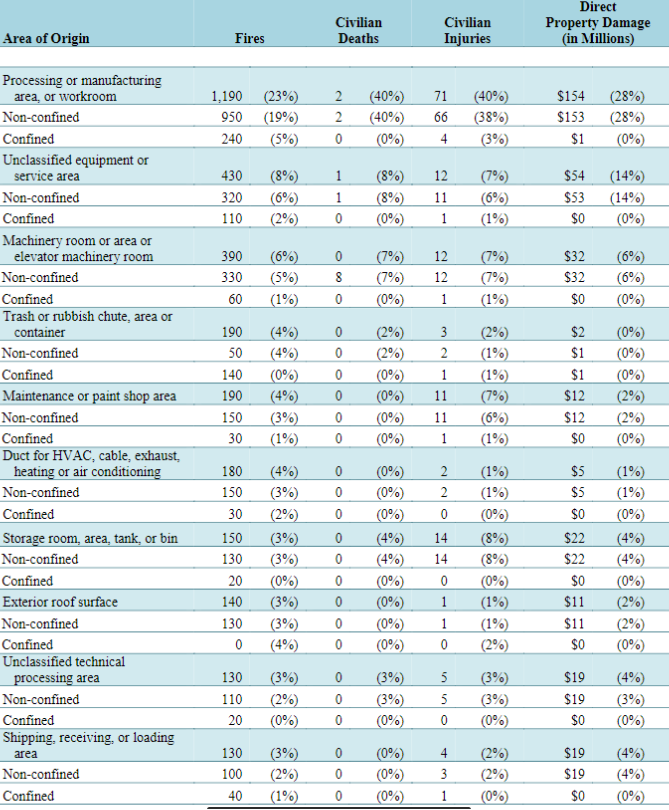
Table 18.
Structure Fires in Manufacturing PropertiesBy Area of Origin, 2011-2015 Annual Averages (Continued)

Note: Sums may not equal totals due to rounding errors. Confined structure fires other than chimney or flue fires (NFIRS incident type 113, and 115-118) were analyzed separately from non-confined structure fires (incident type 110-129, except 113-118). See Appendix A for details.Source: NFIRS 5.0 and NFPA Fire Experience Survey.
Table 18.
Structure Fires in Manufacturing PropertiesBy Area of Origin, 2011-2015 Annual Averages (Continued)
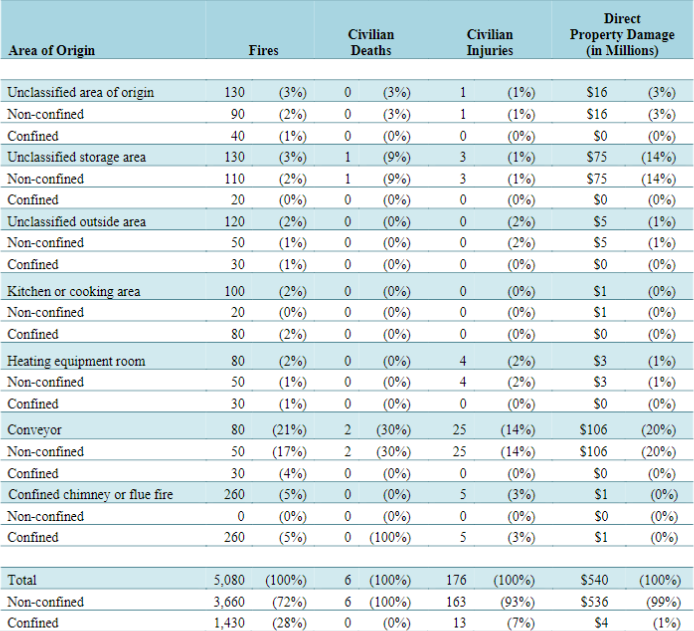
Note: Sums may not equal totals due to rounding errors. Confined structure fires other than chimney or flue fires (NFIRS incident type 113, and 115-118) were analyzed separately from non-confined structure fires (incident type 110-129, except 113-118). See Appendix A for details.Source: NFIRS 5.0 and NFPA Fire Experience Survey.
To be continued...
Registered
4
Average
daily search
70%
Effective
search
236
Registered
companies
You are using BETA version.
Send feedback