

6359
FIRES IN INDUSTRIAL AND MANUFACTURING PROPERTIES - PART 2
06/19/2018
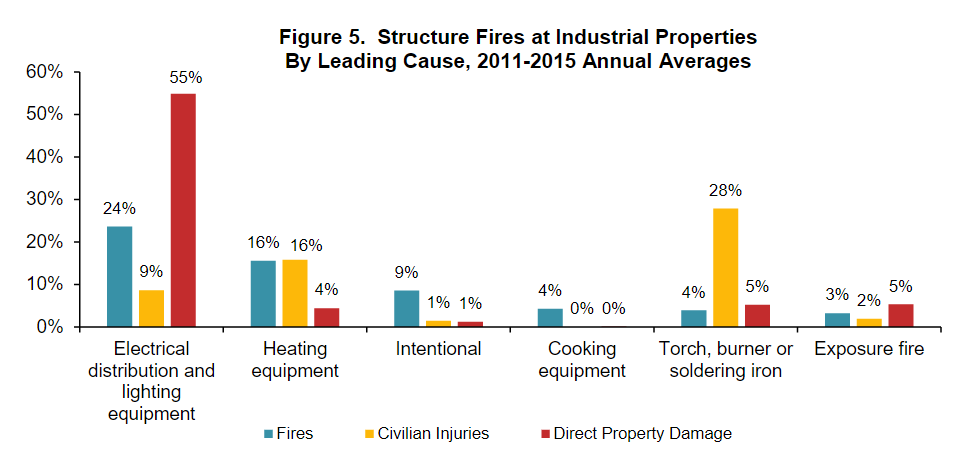
The fires caused by electrical distribution and lighting equipment accounted for over half (55%) of direct property damage, as well as 9% of civilian injuries of these structure fires. Fires caused by heating equipment accounted for 16% of civilian injuries. Nine percent of the fires had an intentional cause, but these fires were associated with 1% of civilian injuries and 1% of direct property damage. Figure 5 shows that other leading causes included cooking equipment (4%), torch, burner or soldering iron (4%), and exposure fires (3%). Fires caused by a torch, burner, or soldering iron were associated with 28% of civilian injuries. See Table 5 for more detailed information on leading causes.
In addition to electrical distribution and lighting equipment and heating equipment, Table 6 shows that other leading types of equipment involved in the ignition of industrial properties included cooking equipment (4% of total), a torch, burner, or soldering iron (4%), and fans (2%). The 4% of fires involving a torch, burner or soldering iron a ccounted for 28% of civilian injuries. Table 6 also shows that among specific types of electrical distribution and lighting equipment, transformers and power supplies accounted for 7% of fires, but 46% of direct property damage. Approximately three of five structure fires (59%) in industrial properties had an unintentional cause. These fires accounted for all civilian deaths, 85% of civilian injuries, and 46% of direct property damage. The remaining fires were due to a failure of equipment or heat source (25%), were intentionally set (9%), were acts of nature (5%), or had an unclassified cause (3%). See Table 7. An electrical failure or malfunction was a factor contributing to the ignition of one in five structure fires (20%) in industrial properties, accounting for 9% of civilian injuries and 17%of direct property damage. Table 8 shows that a mechanical failure or malfunction contributed to the ignition of 17% of these fires (8% of civilian injuries and 25% of direct property damage), while a heat source located too close to combustibles was a factor in 10% of fires, but one quarter (25%) of civilian injuries, and 4 % of direct property damage. Other leading factors in these fires included outside or open fires for debris or waste disposal (6%), abandoned or discarded material or product (5%), and cutting or welding too close to combustibles (5%).
Unclassified heat from powered equipment (14 %), arcing (13%), radiated or conducted heat from operating equipment (12%), and spark, ember, or flame from operating equipment (9%) were the leading heat sources of fires at industrial property structure fires. See Table 9.
Arcing fires caused 30% of direct property damage and those associated with a spark, ember, or flame from operating equipment caused 26% of civilian injuries. The leading areas of fire origin in these fires were unclassified outside area, unclassified storage area, and unclassified equipment or service area, each with 7% of the total.See Table10. The fires originating in unclassified storage areas accounted for 25% of direct property damage and those originating in unclassified equipment or service area accounted for 10% of civilian injuries. Table 10 shows that fires originating in a processing or manufacturing area or workroom accounted for 4% of fires, but 18% of civilian injuries.
Leading items first ignited were an agricultural crop (including fruits and vegetables), a flammable or combustible liquid or gas, piping or filter, and electrical wire insulation, each accounting for 9% of fires. Fires ignited by flammable or combustible liquidor gas, piping or filter were associated with 42% of civilian injuries, and 22% of direct property damage , while thoseignited by electrical wire or cable insulation accounted for 11% of direct property damage. The other leading items first ignited included rubbish, trash, or waste (8%), an unclassified item (8% offires), and a structural member or framing (7%). See Table 11.
Two in five fires were confined to the object of origin, either by virtue of being coded as confined fires (25%) or as confined to object of origin (15%). See Figure 6 and Table 12. Fourteen percent of fires were confined to the room of origin, while 6% were confined to the floor of origin, 43% to the building of origin, and 12% extended beyond the building of origin. The 9% of fires that extended beyond the building of origin accounted for 15% of the direct property damage.

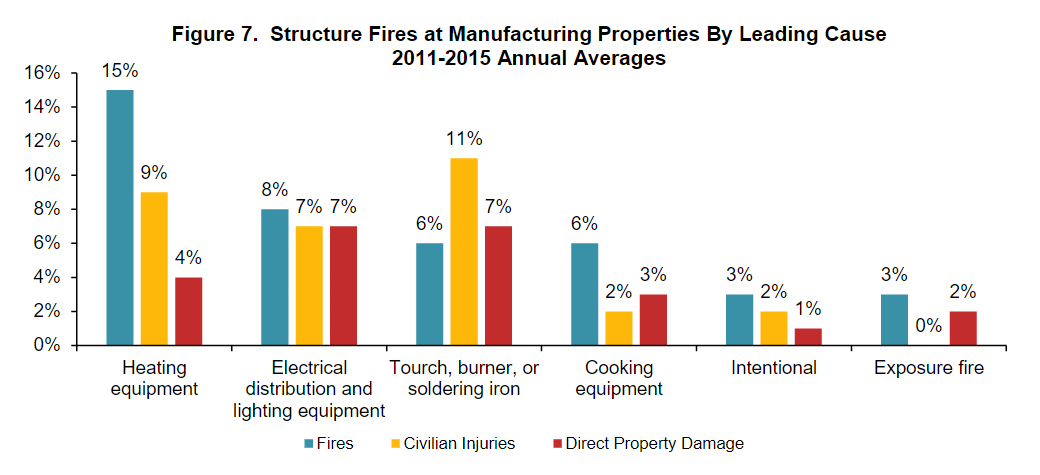
A. Manufacturing Properties Heating equipment (15%), electrical distribution and lighting equipment (8%), torch, burner,or soldering iron (6%), and cooking equipment (6%) were the leading causes of structure firesin manufacturing properties from 2011 to 2015. Figure 7 shows that other leading causes included intentional fires and exposure fires. Of the leading causes, fires started by a torch, burner, or soldering iron accounted for the highest share of civilian injures (11%), as well as 7% of direct property damage. The fires caused by heating equipment accounted for 9% of civilian injuries in these structure fires, as well as 4% of direct property damage. Fires caused by electrical distribution and lighting equipment accounted for 7% of civilian injuries and 7% of direct property damage Also see Table 13.
In addition to heating equipment, electricaldistribution and lighting equipment, and cooking equipment, other leading types of equipment involved in the ignition of manufacturing property fires included a torch, burner, or soldering iron(6%),and heattreating equipment(4%).
A smaller share of fires wereignited by an industrial furnace or kiln (3%), casting, molding, or forging equipment (3%), a fan (3%), a power sander, grinder, buffer, or polisher(2%), air compressors(2%), and extractor or waste recovery machines (2%). The 3% fires involving casting, molding, or forging equipment accounted for 19% of direct property damage. See Table 14.
Approximately three of five structure fires (59%) in manufacturing property fires had an unintentional cause. These fires accounted for a 75% civilian deaths, 74% of civilian injuries, and 67% of direct property damage. The remaining fires were due to a failure of equipment or heat source (29%), were intentionally set (3%), had an unclassified cause (2%), or were acts of nature (1%). See Table 15.
A mechanical failure or malfunction was a factor contributing to the ignition of almost three in ten structure fires (28%) in manufacturing properties, accounting for 68% of civilian deaths, 31%of civilian injuries and 22% of direct property damage. Table 16 shows that an electrical failure or malfunction was a factor contributing to the ignition of 13% of these fires, as well as 9% of civilian injuries and 12% of direct property damage, while failure to clean was a factor in 11% of fires, 10% of civilian deaths, 9% of civilian injuries, and 5% of direct property damage. Cutting or welding too close to combustibles (7%) and heat source too close to combustibles (7%) were other leading contributing factors.
Unclassified heat from powered equipment (18%), radiated or conducted heat from operatingequipment (16%), and spark, ember, or flame from operating equipment (15%) were the leading heat sources of fires at manufacturing property structure fires. See Table 17. Fires in which the heat source was unclassified heat from powered equipment were associated with 17% of civilian injuries and 24% of direct property damage, while those associated with a spark, ember, or flame from operating equipment caused 15% of civilian injuries. Other leading causes included unclassified heat from hot or smoldering equipment(8% of fires) and arcing (8%).
The leading area of fire origin in these fires was processing or manufacturing area or workroom, wit h 23% of the total. These fires were associated with 40% of civilian deaths, 40%of civilian injuries, and 28% of direct property damage.Unclassified equipment or service areas were the areas of origin in 8% of the total. The fires originating in unclassified equipment or service area accounted for 7% of civilian injuries. See Table 18 for additional details on area of origin.
Leading items first ignited were dust, fiber, lint (including sawdust or excelsior), with 16% of the total fires and flammable or combustible liquid or gas, piping or filter, with 15%. Fires ignited by flammable or combustible liquid or gas, piping or filter were associated with 48% of civilian deaths, 36% of civilian injuries, and 24% of direct property damage. Other leading items first ignited included unclassified items (8% of fires), rubbish, trash, or waste (6%) and electrical wire orcable insulation (6%). See Table 19 for item first ignited details.
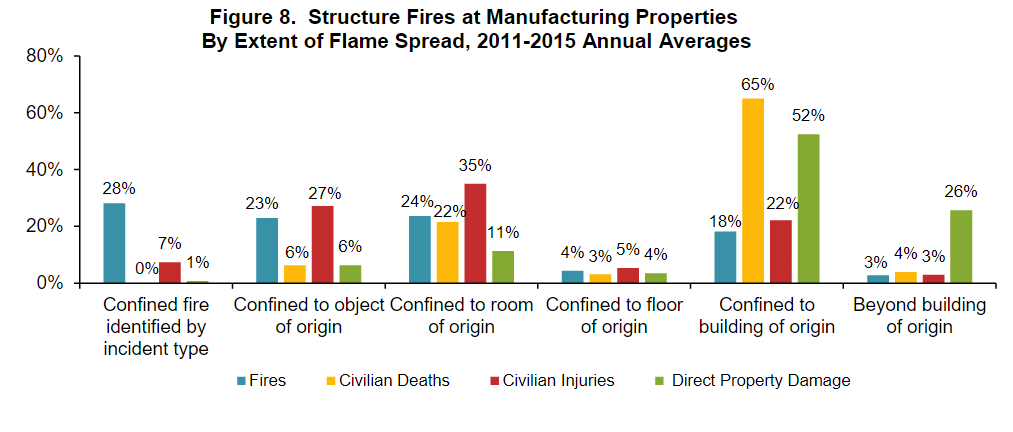
Just over half of structure fires in manufacturing properties were confined to the object oforigin, either by virtue of being coded as confined fires (28%) or as confined to object oforigin (23%). See Figure 8 and Table 20. Almost one quarter of fires (24%) were confined to the room of origin. Four percent of fires were confined to the floor of origin, 18% to the building of origin, and 3% extended beyond the building of origin. The fires confined to the room of origin accounted for 35% of civilian injuries.
Vehicle Fires
There were an estimated annual average of 3,410 vehicle fires at industrial or manufacturing properties from 2011 to 2015. Vehicle fires caused annual averages of six civilian fatalities, 17 civilian injuries, and $125 million in direct property damage. The 9% of industrial or manufacturing property fires that occurred in vehicles accounted for 34% of civilian deaths, as well as 6% of civilian injuries and 11% of direct property damage associated with all fires in industrial or manufacturing properties. See Table A on page 1.
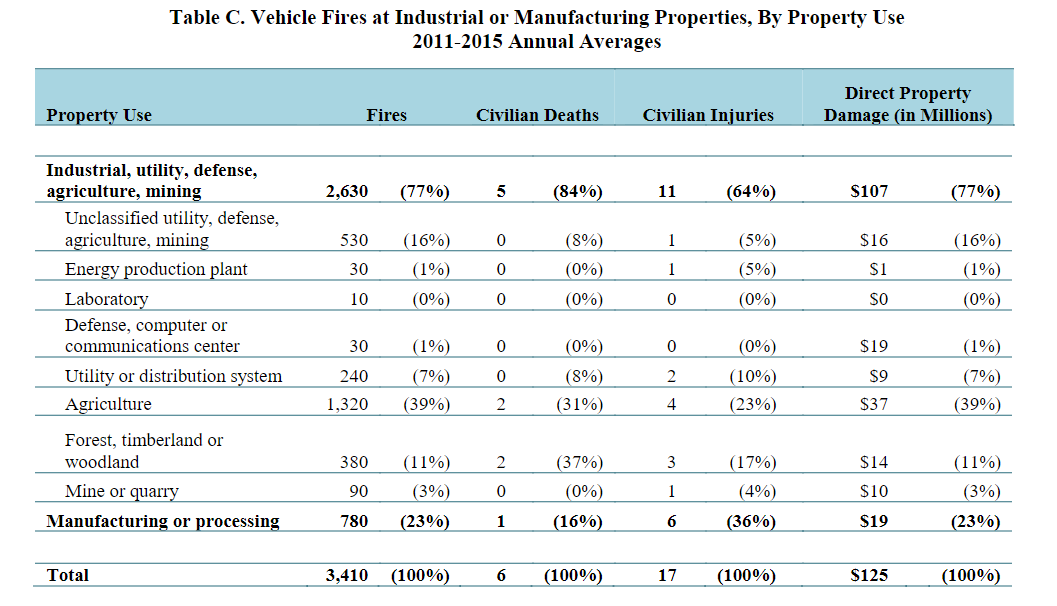
Two of five (39%) vehicle fires at industrial or manufacturing properties occurred in properties used by agriculture. See Table C. These fires accounted for 23% of civilian injuriesand 39% of direct property damage. Properties with manufacturing or processing uses accounted for 23% of fires, but 36% of civilian injuries, while those classified as forest, timberland, or woodland represented 11% of fires, but 37% of civilian deaths. It should be noted that the low numbers of civilian deaths require that these results be interpreted cautiously. Other leading property uses where vehicle fires occurred were utility or distribution systems (7% of fires) and mines or quarries (3%).
A.Industrial Properties
Timing of Fires
The peak months for vehicle fires in industrial properties were September (10% of total), October (15%), and November (10%). December (6% of fires), January (6%), February (5%), and March (6%) recorded the fewest fires. See Table 21. Table 22 shows that Sundays (11%) had the fewest fires, with the remaining days of the week recording 14% or 16% shares of total fires. Just under one-fifth of the fires (19%) occurred in the 12 -hour period between 9 p.m. and 9 a.m., as shown in Table 23.
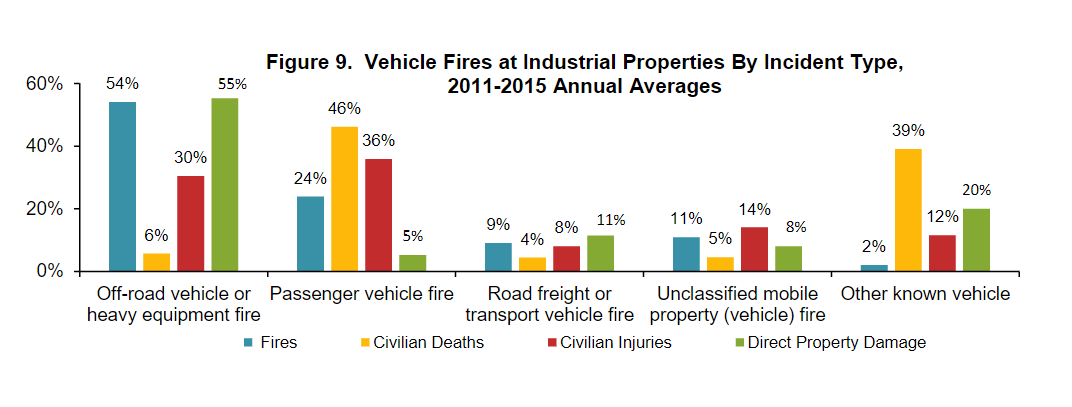
Over half of vehicle fires (54%) at industrial properties involved off-road vehicles or heavy equipment, and these fires were associated with 6% of civilian deaths, 30% of civilian injuries and 55% of direct property damage caused by vehicle fires. See Figure 9 and Table 24. Fires in passenger vehicles accounted for 24% of fires, accounting for 46% of civilian deaths, 36% of civilian injuries, and 5% of direct property damage, while fires in unclassified mobile vehicles accounted for 11% of vehicle fires and road freight or transport vehicles for 9%. Fires in other known vehicles accounted for 2% of vehicle fires, but 39% of civilian deaths, 12% of civilian injuries, and 20% of direct property damage. Nearly all of these losses were in aircraft fires, which represented less than 1% of vehicle fires.
A mechanical failure or malfunction was the leading factor contributing to ignition of industrial property vehicle fires (46% of total), followed by electrical failure or malfunction (15%). Amechanical failure or malfunction was associated with 44% of civilian injuries and 53%of direct property damage from these fires. Other leading factors contributing to ignition included unclassified factors (8% of fires), heat source too close to combustibles (6%), failure to clean (5%),and exposure fires (4%). See Table 25.
The leading heatsources for vehicle fires were unclassified heat from powered equipment (25%) and radiated or conducted heat from operating equipment (20%). Unclassified heat from powered equipment was associated with 20% of civilian deaths, 38% of civilian injuries, and 29% of direct property damage. Other leading heat sources included a spark, ember, or flame from operating equipment (12% of fires), arcing (11%), and heat or spark from friction (7%). See Figure 10 and Table 26.

The leading area of origin for vehicle fires at industrial properties was an engine area, running gear, or wheel area of the vehicle (51% of fires), which accounted for 41% of civilian deaths, 35% of civilian injuries, and 55% of direct property damage. An unclassified vehicle area was the area of origin in 12% of fires, with 28% of civilian deaths, 12% of civilian injuries, and 9% of direct property damage. Other leading areas of origin included the passenger area of the vehicle (7% of fires), a lawn, field, or open area (6%), and an exterior surface of the vehicle (5%). See Table 27.
The items first ignited in vehicle fires at these properties were most often flammable or combustible liquids or gases, piping or filter (21% of fires), agricultural crops (20%), and electrical wire or cable insulation (16%). Fires ignited by flammable or combustible liquids or gases, piping or f ilter were responsible for 89% of civilian deaths, 52% of injuries and 40% of direct property damage. See Table 28.
Just over half of vehicle fires in industrial properties (52%) had an unintentional cause.Failure of equipment or heat source (35%), intentional fires (9%), and unclassified causes (3%) accounted for the majority of remaining causes. See Table 29.
B.Manufacturing Properties
Timing of Fires
There was little variation in vehicle fir es in manufacturing properties by month. Table 30 indicates that October and December each accounted for 7% of fires, and all other months had 8% or 9% of the annual total. Table 31 shows that Saturdays (10% of total) and Sundays (8%) had the fewest fires, with the remaining days of the week recording 16% or 17% shares of total fires. Almost two in five fires (37%) occurred in the six hour period between 10 a.m. and 4 p.m., as shown in Table 32.
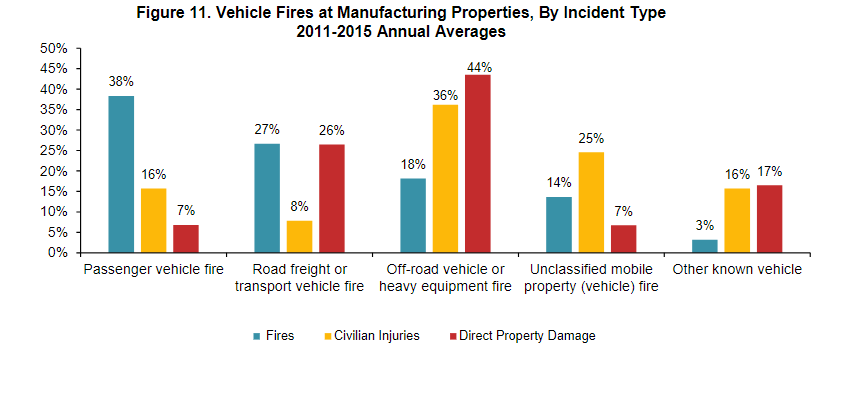
Fires in passenger vehicles accounted for 38% of vehicle fires at manufacturing properties. See Figure 11 and Table 33. Fires in road freight or transportation vehicles accounted for 27% of fires, while fires in off-road vehicles or heavy equipment accounted for 18% of fires, but 36% of civilian injuries and 44% of direct property damage. Another 14% of fires involved unclassified mobile vehicles. Fires in other known vehicles accounted for 3% of vehicle fires, but 16% of civilian injuries and 17% of direct property damage. Most of the direct property damage involving other known vehicles were in aircraft fires, which represented 0.1% of vehicle fires.
A mechanical failure or malfunction was the leading factor contributing to ignition of manufacturing property vehicle fires (37% of total), followed by electrical failure or malfunction (22%). A mechanical failure or malfunction was associated with 32% of civilian injuries and 32% of direct property damage from these fires, although the injury results should be treated cautiously due to low numbers. Other leading factors contributing to ignition included exposure fires (11%), unclassified factors (6% of fires), heat source too close to combustibles (5%), and cutting or welding too close to combustibles (4%). See Table 34.
The leading heat sources for vehicle fires at manufacturing properties were unclassified heat from powered equipment (23% of fires), arcing (17%), and radiated or conducted heat from operating equipment (13%). Other leading heat sources included a spark, ember, or flame from operating equipment (8% of fires), an unclassified hot or smoldering object (7%), and an unclassified heat source (6%). The 8% of fires involving a spark, ember, or flame from operating equipment accounted for 30% of direct property damage. Table 35.
The leading area of origin for vehicle fires at manufacturing properties was an engine area, running gear, or wheel area of the vehicle (49% of fires), which accounted for 17% of civilian injuries and 42% of direct property damage. A passenger area (10%), cargo or trunk (9%), unclassified vehicle area (8%), and exterior surface (7%) were other leading areas of origin. See Table 36 for details.
The items first ignited in vehicle fires at these properties were electrical wire or cable insulation (26%), flammable or combustible liquids or gases, piping or filter (18%), and unclassified items (16%).Fires ignited by flammable or combustible gases, piping and filter were responsible for almost half (48%) of direct property damage. See Table 37. Three in 10 of vehicle fires in manufacturing properties (59%) had an unintentional cause.Failure of equipment or heat source (30%), unclassified causes (7%) and intentional fires (3%), accounted for the remaining causes. See Table 38.
Outside and Unclassified Fires
The largest share of fires at industrial and manufacturing properties took place in outside and unclassified locations.Outside and unclassified fires are a broad designation comprised of two separate categories – “outside trash or rubbish fires” and “non-trash outside and unclassified fires.” While 71% of fires in industrial or manufacturing properties during the 2011-2015 period were outside and unclassified fires, their share of losses was comparatively small (17% of civilian deaths, 14% of civilian injuries, and 22% of direct property damages). Nearly all of the losses were associated with non-trash outside and unclassified fires. See Table A.
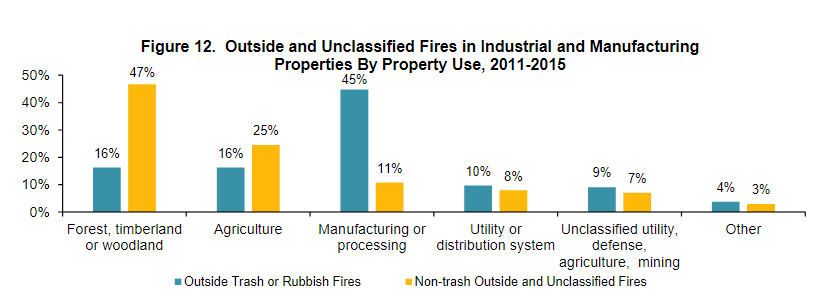
As shown in Figure 12 and Table 39, 45% of outside trash or rubbish fires at industrial and manufacturing properties occur in manufacturing or processing properties (45%), with agricultural locations and forest, timberland, or woodland locations each recording 16% of the total. Table 40 shows that the non-trash outside and unclassified fires at these properties primarily occur in forest, timberland, or woodland (47%) or agricultural (25%) locations.
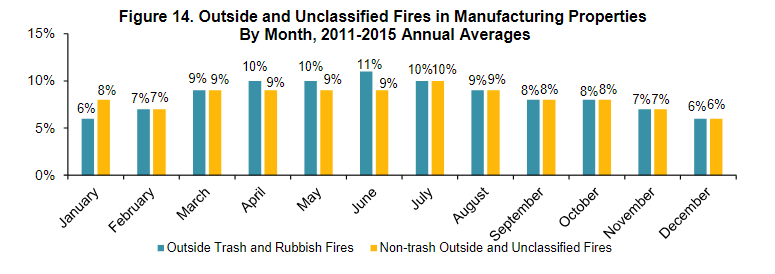
Timing of Fires. Figure 13 and Figure 14 show that outside trash and rubbish fires and non-trash outside and unclassified fires generally followed a similar monthly pattern in both industrial and manufacturing properties, with fewer fires in the cold weather months from November through February and a greater number of fires between March and July. Table 41 shows that three in ten outside trash and rubbish fires in industrial settings occurred in the three month period from March through May. As Figure 13 shows, the peak months were highest in the case of non-trash outside and unclassified fires in industrial settings, with 12% of fires in March and 13% in April, with lows of 3% in December and 6% in January. See Table 42 for more details.
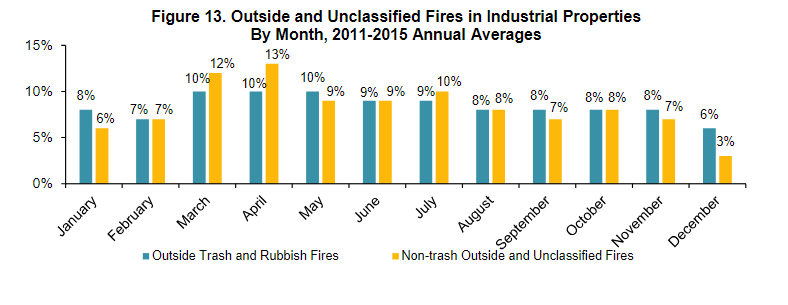
Figure 14 shows the monthly distribution of outside and unclassified fires in manufacturing properties. The high point for outside trash and rubbish fires came in June, with 11% of the total, followed by April, May, and July, each with 10%. Also see Table 43. Non-trash outside and unclassified fires in manufacturing facilities peaked in July (10% of total), with March, April, May, June, and August each having a 9% share of the annual fire total. Additional details are available in Table 44.
Saturday was the peak day for outside trash and rubbish fires (16% of annual total) and non-trash outside and unclassified fires (17%) in industrial properties. These fires ranged from 13% - 15%during the remaining days of the week, with no obvious pattern. Details are available in Table 45and Table 45A. In manufacturing properties, there were fewer trash and rubbish fires on Saturdays (12% of weekly total) or Sundays (10%) than on weekdays, which ranged from 14% to 17%. Non-trash outside and unclassified fires in manufacturing properties showed similar results – 12% of fires on Saturdays, 10% on Sundays, and 15% to 16% on weekdays. See Table 46 and Table46A.
There were fewer outside trash and rubbish fires and non-trash outside and unclassified fires in overnight hours and more fires in the afternoon and early evening in both industrial (Table 47 and Table 47A) and manufacturing properties (Table 48 and Table 48A). There was less variation in the hourly distribution of fires in manufacturing properties (hourly range from 2% to 7%) than in industrial properties (hourly range from 1% to 11%).
A.Industrial Properties
Intentionally set fires were the leading cause ofoutside trash and rubbish fires in industrial properties, accounting for 50% of the total. Other leading causes included smoking materials (6%), torch, burner, or soldering iron (4%), and electrical distribution and lighting equipment (2%). See Table 49.
Non-trash outside and unclassified fires in these properties also most often had an intentionalcause (15%). The other leading causes included lightning (11%), exposure fires (3%), smoking materials (3%), torch, burner, or soldering iron (2%), and playing with a heat source (2%). See Table 49A.
The leading factor contributing to the ignition of outside trash and rubbish fires in industrial properties was outside or open fire for debris or waste disposal, accounting for nearly three in ten fires (29%). Figure 15 shows that other leading factors contributing to the ignition of these fires included abandoned or discarded materials or products (20%), unclassified factors (9%), high winds (7%),unclassified natural conditions (6%), agriculture or land management burns (5%), rekindling (5%), and unclassified misuse of material or product (5%). Also see Table 50.

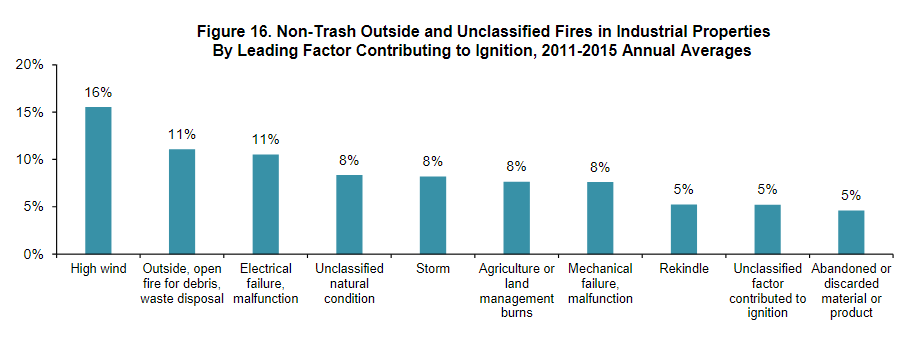
In non-trash outside and unclassified fires in industrial properties, the leading factor contributing to ignition was high wind, accounting for 16% of fires. Other leading factors included outside or open fires for debris or waste disposal (11%), electrical failure or malfunction (11%), unclassified natural condition (8%), storms (8%), agriculture or land management burns (8%), mechanical failure or malfunction (8%), rekindling (5%), unclassified factors (5%), and abandoned or discarded material or product (5%). See Figure 16 and Table 50A.
A match served as the heat source in 15% of outside trash and rubbish fires in industrial properties. As shown in Table 51, other leading heat sources included hot ember or ash (13%), unclassified heat sources (11%), a lighter (11%), an unclassified hot or smoldering object (9%), a flame or torch used for lighting (8%), smoking materials (6%), or spontaneous combustion or chemical reaction (6%).
In non-trash outside and unclassified fires in these properties, the leading heat source was hot ember or ash (15%). Table 51A shows that other leading heat sources included lightning (11%), arcing (10%), unclassified heat sources (8%), a spark, ember, or flame from operating equipment (7%), a flying brand, ember, or spark (6%), and match (6%).
Rubbish, trash, or waste was the item first ignited in 30% of outside trash and rubbish fires in industrial properties. Other leading items first ignited were: light vegetation, including grass (14%), unclassified organic materials (9%), heavy vegetation, including trees (7%), unclassified items (7%), agricultural crops, including fruits and vegetables (6%), and multiple items (4%). See Table 52 for details.
In non-trash outside and unclassified fires in these properties, light vegetation, including grasswas the item first ignited in two of five fires (39%) in industrial properties. The other leading items first ignited were: heavy vegetation, including trees (20% of fires), agricultural crops, including fruits and vegetables (14%), unclassified items (5%), unclassified organic materials (5%), and electrical wire or cable insulation (4%). Additional information is available in Table 52A.
B.Manufacturing Properties
Intentionally set fires were the leading cause of outside trash and rubbish fires in manufacturing properties, accounting for 16% of the total. Other leading causes included smoking materials (10%), torch, burner, or soldering iron (6%), and electrical distribution and lighting equipment (2%). See Table 53.
The leading cause ofnon-trash outside and unclassified fires in these properties was electrical distribution and lighting equipment, accounting for 11% of fires. As shown in Table 53A, other leading causes of non-trash outside and unclassified fire in manufacturing properties included a torch, burner, or soldering iron (7%), an intentional cause (4%), and smoking materials (2%).
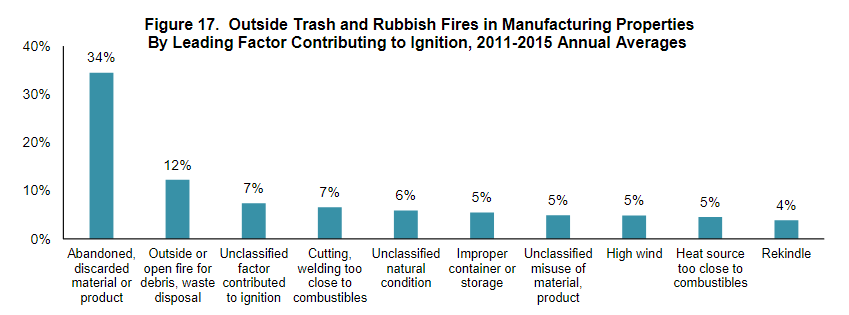
The leading factor contributing to the ignition of outside trash and rubbish fires in manufacturing properties was abandoned or discarded material or product, accounting for 34% of fires. The other leading factors contributing to the ignition of these fires included outside or open fires for debris or waste disposal (12%), unclassified factors (7%), cutting or welding too close to combustibles (7%), unclassified natural conditions (6%), improper container or storage (5%), unclassified misuse of material or product (5%), high wind (5%), heat source too close to combustibles (5%), and rekindle (4%). See Figure 17 and Table 54.
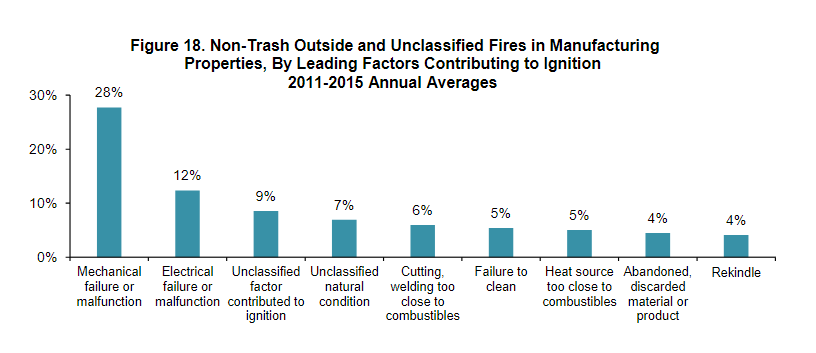
The leading factor contributing to the ignition of non-trash outside and unclassified fires was mechanical failure or malfunction, with 28% of the manufacturing property fires. Other factors included electrical failures or malfunctions (12%), unclassified factors (9%), unclassified natural conditions (7%), cutting or welding too close to combustibles (6%), failure to clean (5%), heat source too close to combustibles (5%), abandoned or discarded material or product (4%), and rekindle (4%). See Figure 18 and Table 54A.
Spontaneous combustion or chemical reaction provided the heat source in approximately one-fifth (19%) of outside trash and rubbish fires in manufacturing properties. Other leading heat sources included unclassified hot or smoldering objects (17%), smoking materials (10%), hot ember or ash (10%), lighters (7%), molten or hot material (6%), matches (5%), unclassified heat sources (5%), and spark, ember, or flame from operating equipment (5%). See Table 55.
The leading heat source in non-trash outside and unclassified fires in manufacturing properties was unclassified heat from operating equipment (18% of total). As shown in Table 55A, a spark, ember, or flame from operating equipment (11%), unclassified hot or smoldering objects (11%), radiated or conducted heat from operating equipment (9%), arcing (8%), unclassified heat sources (7%), hot ember or ash (7%), spontaneous combustion or chemical reaction (6%), heat or spark from friction (6%), and molten or hot material (5%) were other leading heat sources in non-trash outside and unclassified fires in manufacturing properties.
The item that was most often first ignited in outside trash and rubbish fires in manufacturing properties was rubbish trash, or waste, accounting for over two in five fires (44%). Other leading factors included dust, fiber, or lint, including sawdust or excelsior (8%), unclassified items (7%), multiple items (6%), and unclassified organic materials (4%). See Table 56 for details.
In non-trash outside and unclassified fires in manufacturing properties, flammable or combustible liquids or gases, piping or filter were the leading item first ignited, with 15% of the total. Table 56A shows that other leading items included unclassified items (14%), dust, fiber or lint, including sawdust or excelsior (14%), light vegetation, including grass (11%), unclassified organic materials (8%), and electrical wire or cable insulation (5%).
to be continued...
Source: https://www.nfpa.org/
Registered
4
Average
daily search
70%
Effective
search
236
Registered
companies
You are using BETA version.
Send feedback