

6351
Fires in Industrial and Manufacturing Properties - part 1
06/11/2018
Keywords: fire statistics, industrial fires, manufacturing fires, non -residential fires, research, exposure to hazards, US/National, discarded materials, structure fires, electrical failures, mechanical failures, confined structure fires, vehicle fires.
Acknowledgements
The National Fire Protection Association thanks all the fire departments and state fire authorities who participate in the National Fire Incident Reporting System (NFIRS) and the annual NFPA fire experience survey. These firefighters are the original sources of the detailed data that make this analysis possible. Their contributions allow us to estimate the size of the fire problem. We are also grateful to the U.S. Fire Administration for its work in developing, coordinating, and maintaining NFIRS. To learn more about research at NFPA visit www.nfpa.org/research.
Industrial and Manufacturing Property Fires
During 2011–2015, an estimated 37,910 fires in industrial and manufacturing properties were reported to U.S. fire departments per year. These included:
- 26,730 outside or unclassified fires
- 7,770 structure fires
- 3,410 vehicle fires
- An estimated $1.2 billion in property damage per year
Fires in Industrial or Manufacturing Properties by Incident Type,
2011–2015
Annual Averages
- Structure fires are more common in manufacturing or processing properties, while vehicle fires are more common in agricultural properties.
- Electrical distribution and lighting equipment was involved in 24% of structure fires, and heating equipment was involved in another 16% of these fires.
- Hot ember or ash was the leading heat source in 15% of outside non-trash fires in industrial properties.
- Vehicle fires are more common in the fall months, particularly in October, likely due to harvesting activities.
Fires in Industrial and Manufacturing Properties Overview
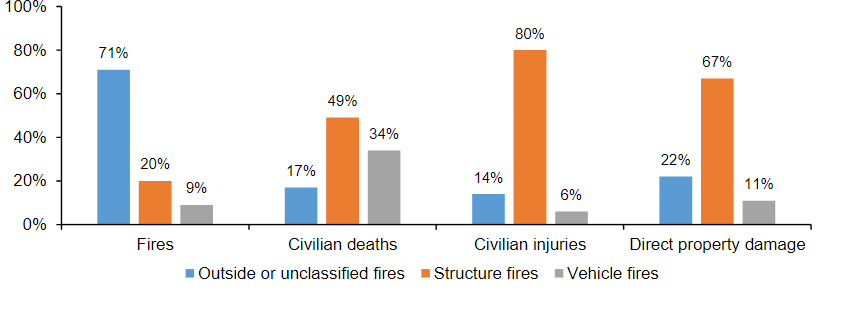
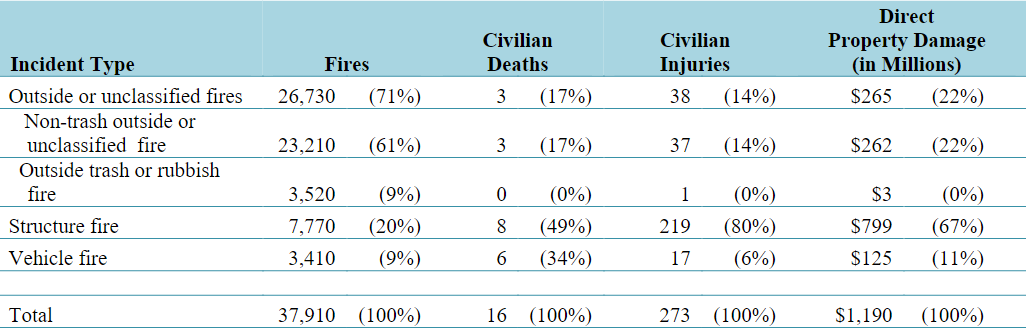
During 2011-2015, there were an estimated 37,910 fires at industrial and manufacturing properties (including utility, defense, agriculture, and mining) reported to U.S. fire departments each year, with associated annual losses of 16 civilian deaths, 273 civilian injuries, and $1.2 billion in direct property damage. As indicated in Table A , the vast majority of these fires (71%) occurred in outside or unclassified locations, with another 20% taking place in structures and 9% of the fires in vehicles. The 20% of fires taking place in structures accounted for the largest shares of losses in all categories – 49% of civilian deaths, 80% of civilian injuries, and 67% of direct property damage.Vehicle fires also accounted for a disproportionate share of civilian deaths, (34%), although this association should be viewed cautiously due to low numbers.
Table A.
Fires in Industrial and Manufacturing Properties, by Incident Type
2011 -2015
Annual Averages
As shown in Figure 1 and Table 1A, f ires at industrial and manufacturing properties have fallen substantially over the past three decades, from 114,500 fires in 1980 to 39,700 in 2015, a 65% decrease. Note: Anew version of the National Fire Incident Reporting System (NFIRS 5.0) wasintroduced in 1999 and gradually adopted by fire departments. Because data for the transition years1999 to 2001 are volatile, estimates for those years are not shown.
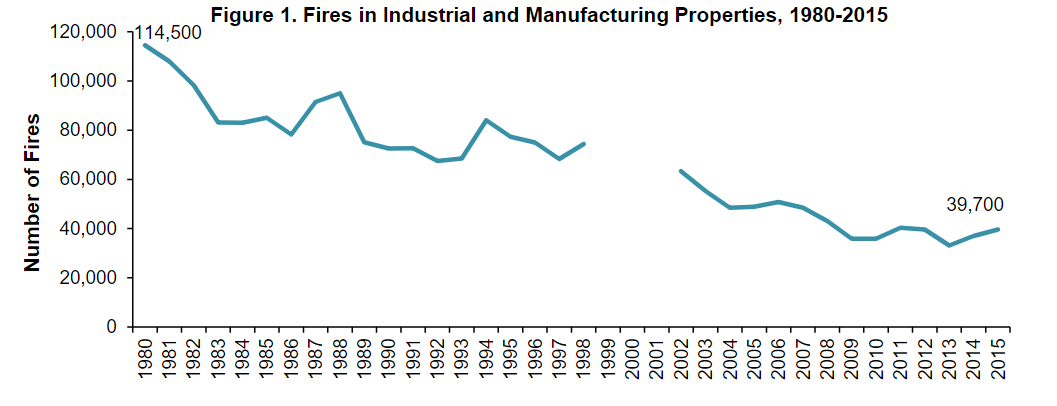
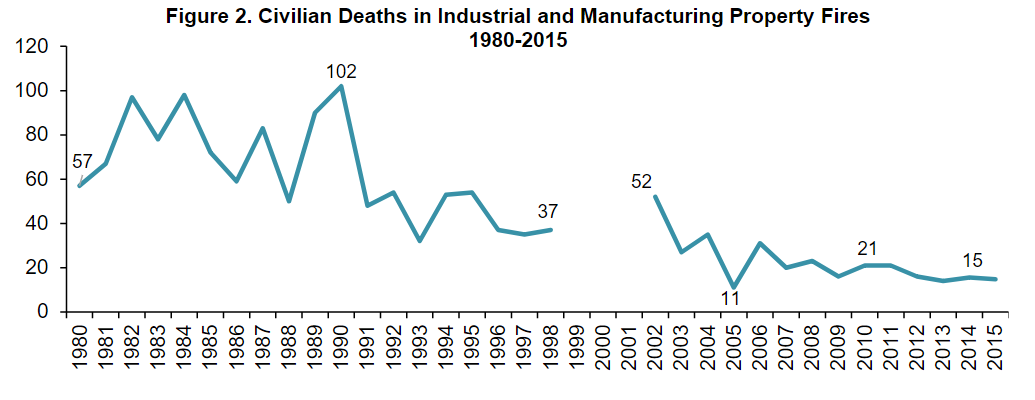
Figure 2 shows that there have been substantial reductions in civilian deaths in industrial and manufacturing properties, although the year -to-year trend is inconsistent. The estimated number of civilian deaths in these fires reached a high of 102 fatalities in 1990 and have been well under that mark in the years since, with fewer than 20 civilian deaths a year since 2012. See also Table 1B.
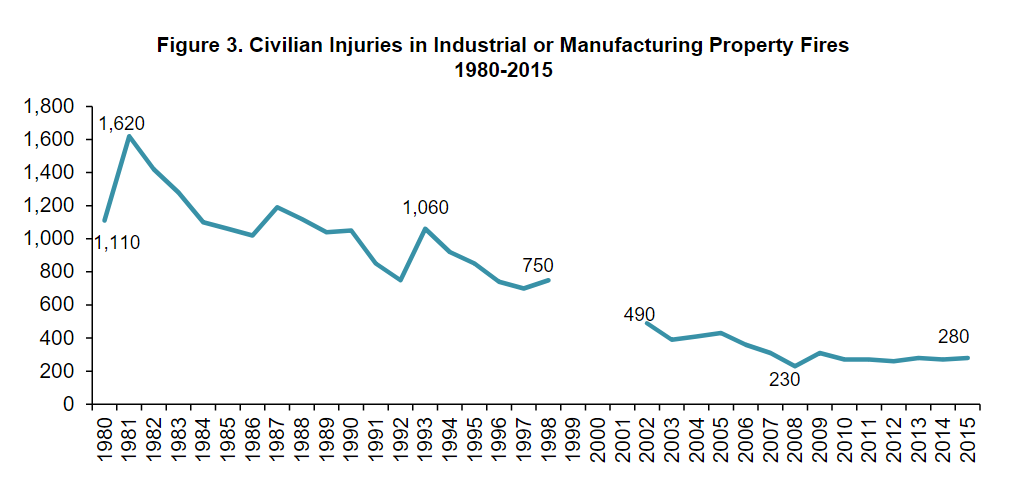
Civilian injuries have also shown a substantial decline, from a peak of 1,620 injuries in 1981 to fewer than 300 each year since 2010, as shown in Figure 3. The trend line for estimated civilian injuries has been fairly flat since 2009. See also Table 1C.
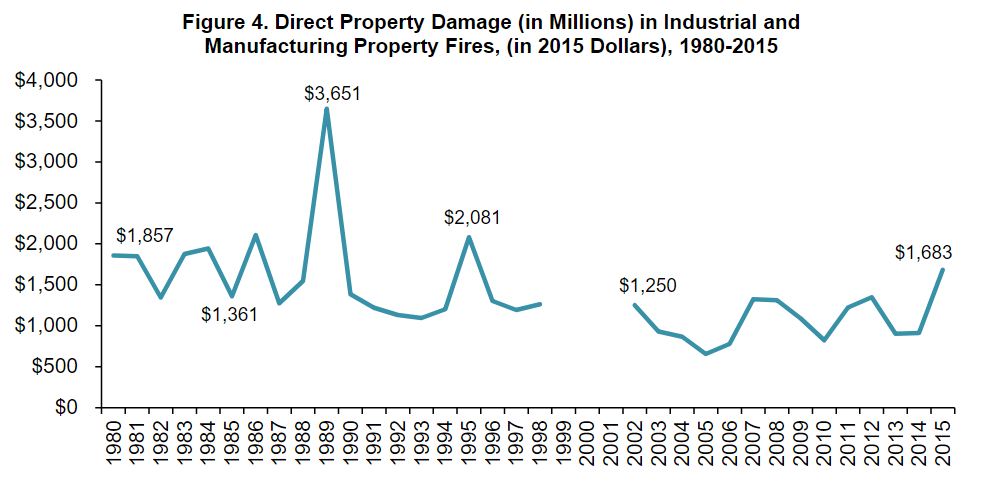
Finally, as shown in Figure 4, annual direct property damages adjusted for inflation are somewhat lower than they were in 1980, but the trend is inconsistent and subject to considerably more year-to-year fluctuation. See Table 1D for direct property damage as reported and Table 1E for direct property damage adjusted for inflation.
Data Sources, Definitions, and Conventions Used in this Report
Unless otherwise specified, the statistics in this analysis are national estimates of fires reported to U.S. municipal fire departments and so exclude fires reported only to Federal or state agencies or industrial fire brigades. The 2011- 2015 estimates are projections based on the detailed information collected in Version 5.0 of the U.S. Fire Administration’s National Fire Incident Reporting System(NFIRS 5.0) and the National Fire Protection Association’s (NFPA’s) annual fire department experience survey. Except for property use and incident type, fires with unknown or unreported data were allocated proportionally in calculations of national estimates. In general, any fire that
occurs in or on a structure is considered a structure fire, even if the fire was limited to contents and the building itself was not damaged.
What are “confined” and “non-confined” fires?
NFIRS 5.0 includes a category of structure fires collectively referred to as “confined fires,” identified by incident type. These include confined cooking fires, confined chimney or flue fires, confined trash fires, confined fuel burner or boiler fires, confined commercial compactor fires, and confined incinerator fires (incident type 113-118). Losses are generally minimal in these fires,which by definition, are assumed to have been limited to the object of origin. Although causal datais not required for these fires, it is sometimes present.
Confined and non- confined fires were analyzed separately and then summed for Cause of Ignition, Heat Source, Factor Contributing to Ignition, Area of Origin, and Item First Ignited. For Equipment Involved in Ignition, the confined fire incident types are assumed to provide causal information without further analysis.
Additional information
Casualty and loss projections can be heavily influenced by the inclusion or exclusion of one unusually serious fire. Except for trend tables, property damage has not been adjusted for inflation.
Fires are rounded to the nearest 100 in trend tables. Otherwise, fires are rounded to the nearest ten, civilian deaths and injuries are rounded to the nearest one, and direct property damage is rounded to the nearest million
dollars. Details on the method ology may be found in Appendix A and Appendix B.
Structure Fires
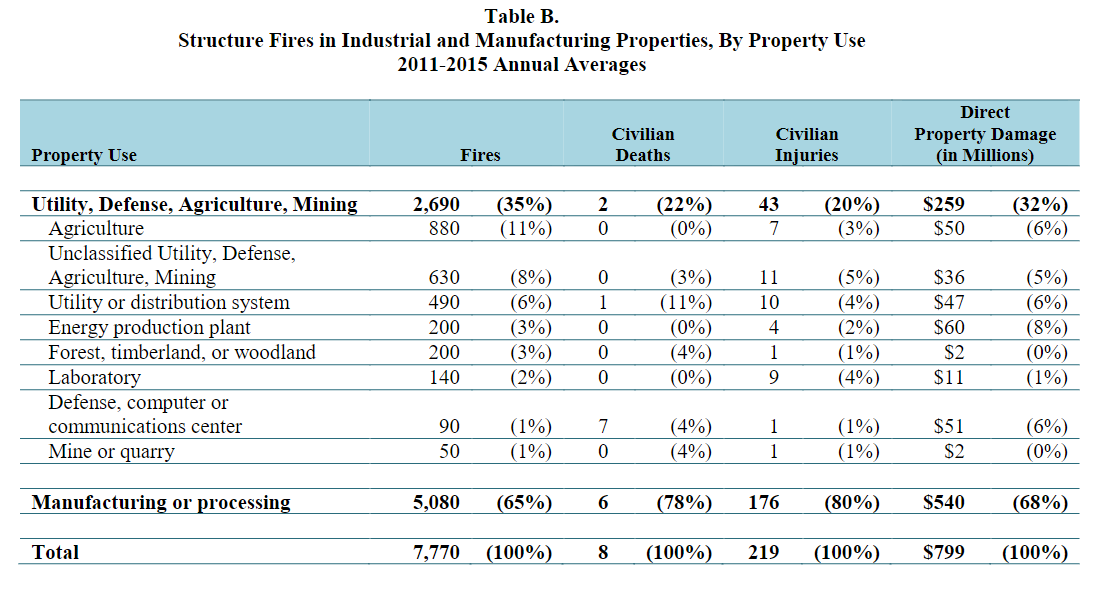
Between 2011 and 2015, municipal fire departments in the U.S. responded to an estimated average of 7,770 structure fires at industrial or manufacturing properties each year, with associated losses of 8 civilian deaths, 219 civilian injures, and $799 million in direct property damage. Nearly two - thirds of the fires (65 %) were in manufacturing or processing properties, and these fires accounted for 78% of civilian deaths, 80% of civilian injuries, and 68% of direct property damage.Fires in agricultural facilities accounted for 11% of fires. Unless otherwise specified, industrial properties in this report refers to properties with NFIRS codes 600 to 699 (Industrial, Utility, Defense,
Agriculture, Mining). See Table B.
Timing of Fires.
Table 2 shows that there was generally little variation from month to month in thedistribution of structure fires at industrial or manufacturing properties over the course of the year.
With the exception of September and December,each with 7% of the annual total, all months recorded 8% to 9% of the annual fire total. The highest shares of injuries occurred in January, May, and December, each of which accounted for 10% of the injury total. August (12%), March (12%) and July (11%) had the highest sharesof direct property damage. As would be expected, fewer fires were recorded on weekends, with Saturdays recording 12% of the total and Sundays accounting for 10% , with each of the weekdays recording 15% to 16% of fires. See Table 3. Two out of five fires (40%) occurred in the 12-hour period from 8:00 p.m. to 8:00 a.m. These fires caused 50
% of direct property damage , 27% of civilian injuries, and45% of civilian deaths. See Table 4.
to be continued...
Source: https://www.nfpa.org/
Registered
4
Average
daily search
70%
Effective
search
231
Registered
companies
You are using BETA version.
Send feedback