

6358
A Methodology to Guide Industrial Explosion Safety System Design - Part 2
08/07/2018
Table 3. Residual risk of safety system failure for each vertex in the grinding and milling example process
| Plant item | Vertex | Risk of failure due to an ignition in the same vessel or any vessel directly connected |
| Grinder | 1 | ζ1 = 2.79 × 10⁻³ |
| Cyclone | 2 | ζ2 = 4.95 × 10⁻³ |
| Bag filter | 3 | ζ3 = 7.10 × 10⁻³ |
| Storage hopper | 4 | ζ4 = 5.43 × 10⁻⁵ |
‡This argument is similar to that presented later, and in more detail, regarding ignition location and isolation barrier placement when using pressure detection, see Figure 3(A) which are both large vessels‡. Unless we have evidence to suggest that Pred (3,2) or Pred (4,2) has been overstated, and thus can be reduced, the best option is to change the suppression system design such that Pred (3,3) is reduced somewhat. In this case, a simple reduction in the suppression actuation pressure from 100 mbar to 50 mbar is sufficient to reduce Pred (3,3) to 0.33 bar and thus reduce ζ1 to 1.16 × 10⁻³. Of course, we must be thoughtful of the impact of any unnecessary or false actuations which may be greater with a reduced actuation pressure on the suppression system fitted to the Bag Filter.
With the risk in the Bag Filter reduced, the Cyclone now becomes greatest at risk with the largest contribution coming from Qs (1,2). This stems from the fact that the barrier is positioned too close to the Grinder and therefore does not allow enough time to establish the barrier before flame passes the barrier location. For efficacious explosion isolation using this hardware, the barrier must be placed at 8.0 m from the Grinder such that tb (1,2) = tf (1,2). However, as shown in Figure 1, the duct-work between the Grinder and the Cyclone is only 5 m long. This represents a very real issue for explosion isolation systems in the practice.
One way to better understand this problem is to calculate the minimum barrier distance, dmin, such that tb (1,2) = tf (1,2) as a function of ignition location in the source vessel. Figure 2 shows this for pressure, optical and dual (pressure AND optical) detection means to actuate the isolation barrier. With pressure detection, the worst case ignition location is close to the duct mouth, since the flame will have started propagating along the duct before the pressure in the source vessel has increased sufficiently to secure detection. Consequently the largest dmin is for ignition close to the duct mouth. For ignition locations far from the duct mouth, the pressure detector will have actuated long before the flame reaches the duct, and as Figure 2 shows, at ignition locations greater than 0.55 m from the duct mouth, the barrier can be place adjacent to the vessel (dmin = 0).
In our Grinder example with pressure detection, we can use Figure 2 to understand the consequences of barrier placement at 3 m. We see that with ignition locations further than 0.42 m from the duct mouth the calculated barrier distance, dmin, is less than our installed location of 3 m and we therefore predict efficacious isolation. However, for ignition locations less than 0.42 m from the duct mouth, dmin is greater than 3 m and we would expect flame passage. This ignition distance, Lpress = 0.42 m, allows us to draw a locus and thus define a volume element in which if ignition were to occur the isolation barrier is likely to fail its mission, see Figure 3 (A). The volume of this hemispherical region close to the duct is 0.144 m3 and so constitutes 7.22% of the total vessel volume. Since we assume that all ignition locations are equally probable, this volume element represents the percentage of ignition locations that will allow flame passage and is represented in our residual risk calculation by Qbarrier (1,2).
Let us investigate changing the detection means for the isolation barrier to an optical detector located within a few duct diameters of the duct mouth. In this case ignition far from the duct is the most challenging case. Here the flame will be travelling very fast as it
‡The explosion enhancement from flame jet ignition is proportional to the connected vessel volume ratios (V1/V2) [Lunn,1996; Holbrow, 1996].
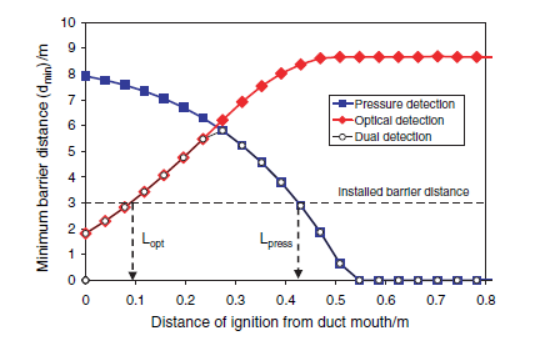
Figure 2. Minimum barrier distance ( i.e. tb (1,2) = tf (1,2)) as a function of distance of ignition location from the duct mouth for pressure, optical and dual (pressure AND optical) detection means to actuate the fast‑acting isolation valve. The Grinder has a volume of 2 m3, with a air velocity through the DN300 duct of 10 m/s. The material has a fuel explosibility rate constant of 150 bar.m/s and the isolation system uses a 50 mbar detection pressure. Lopt and Lpress are indicated for the installed barrier location of 3 m from the Grinder.
Enters the duct (when it is detected), and therefore requires a large barrier distance in order to establish the barrier. For optical detection, ignition close to the duct is the trivial case since the flame is moving very slowly as it propagates from the ignition kernel and will be detected immediately.
We see from Figure 2 that Lopt = 0.09 m and this represents a small volume element (1.52 × 10⁻³ m3) whereby an ignition occurrence would result in efficacious explosion isolation. As shown schematically in Figure 3 (B), optical detection (in this example) is actually much worse than pressure detection, with 99.92% of ignition locations resulting in the isolation barrier failing its mission.
Employing dual detection takes the strengths of pressure and optical detectors, but avoids their respective weaknesses. This is shown in Figure 2 where at distances close to the duct, optical detection will actuate first, while at distances far from the duct pressure detection will actuate first. Using dual detection and locating the barrier at 5.8 m from the Grinder we would cover all possible ignition locations. However, in our example, we are still outside this design guidance and the resulting volume element in which an ignition would result in flame passage is shown schematically in Figure 3 (C) and is simply the difference in volume elements defined by Lpress and Lopt. In this example, we only reduce the volume element to 7.14%, which is only marginally better than pressure detection alone (7.22%) because of the insignificant volume protected by the optical detector.
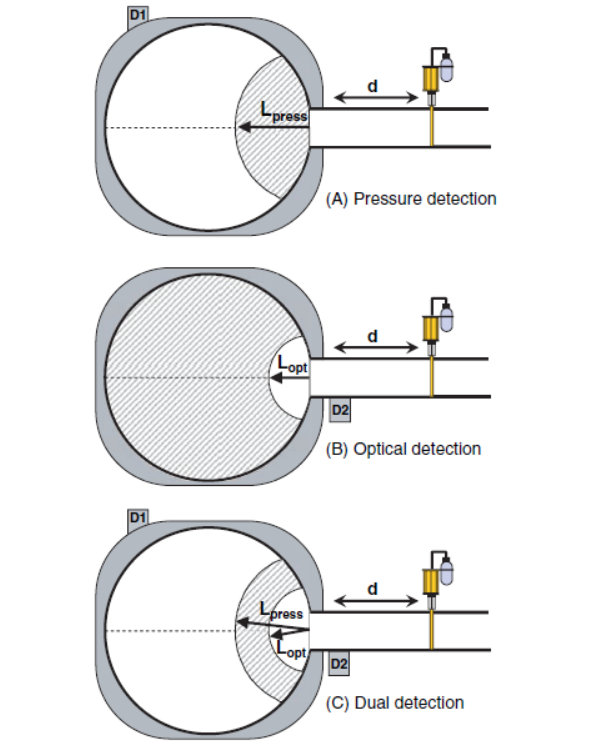
Figure 3. Schematic representation of the volume element (shaded region) in which if ignition occurred the isolation barrier would not prevent flame passage for (A) pressure, (B) optical and (C) dual detection means. Lpress and Lopt represent the radius of the locus at which tf (i, j) = tb (i, j) when using pressure or optical detection respectively.
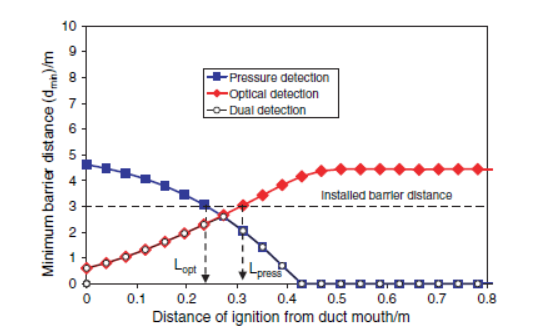
Figure 4. Minimum barrier distance as a function of distance of ignition location from the duct mouth for pressure, optical and dual (pressure AND optical) detection for the Grinder example using a chemically acting isolation barrier
If we were to replace the fast-acting valve with a chemically acting isolation barrier, the latter having a much faster deployment time, we see a marked change in the minimum barrier distances, see Figure 4. When pressure detection is employed, only 1.8% of ignition occurrences will allow flame to pass the barrier, whilst once again optical detection is a poor choice with 96.9% unprotected. However, dmin for dual detection is now less than our installed barrier distance meaning that all ignition locations are now protected. Table 4 shows the residual risk for the Cyclone when using a chemical isolation barrier actuated using either pressure or dual detection means.
Supposing that optical detection for the isolation barrier was not acceptable to the plant operator, maybe due to the frequency of the maintenance schedule of such a device in a dirty environment. Instead the probability of flame propagation and its consequence could be addressed to reduce the risk of safety systems failure.
Table 4. Residual risk of safety system failure in the Cyclone using either pressure or dual detection to actuate the chemical isolation barrier between the Grinder and the Cyclone. tf (1,2) varies for different detection means since the worst case ignition location is used [Moore, 2005]
| Detection means | tb (1,2)È | tf (1,2) | Risk of failure due to an ignition in the cyclone or any vessel directly connected |
| Pressure | 61 | 49 | ζ2 = 8.25 × 10⁻⁴ |
| Dual | 61 | 65 | ζ2 = 1.14 × 10⁻⁴ |
Table 5. Residual risk of safety system failure for each vertex in the grinding and milling example process with explosion suppression fitted to the Grinder and the Cyclone. The tabulated risks are calculated using the changes in safety system design previously discussed, such as the reduced Pred (3,3) and a chemical isolation barrier fitted between the Grinder and the Cyclone actuated via pressure detection.
| Plant item | Vertex | Risk of failure due to an ignition in the same vessel or any vessel directly connected |
| Grinder | 1 | ζ1 = 1.95 × 10⁻⁴ |
| Cyclone | 2 | ζ2 = 3.93 × 10⁻⁵ |
| Bag Filter | 3 | ζ3 = 5.19 × 10⁻⁵ |
| Storage Hopper | 4 | ζ4 = 3.91 × 10⁻⁵ |
Connected vented vessels (without efficacious explosion isolation) are much more likely to result in a flame transfer which can lead to an enhanced explosion occurrence in V2. This stems from the fact that explosion venting simply mitigates against the rapid pressure rise and does not tackle the presence of flame which can lead to further ignition events. This is not the case for explosion suppression whereby the flame front itself is extinguished by the rapidly deployed suppressant agent.
In our example, fitting explosion suppression to the Grinder and the Cyclone, in place of explosion venting would significantly reduce the probability of flame transfer between the plant components. Table 5 lists the residual risk for each plant item with both the Grinder and the Cyclone fitted with explosion suppression as described above. In this case the residual risks have now been reduced by an order of magnitude for the Grinder and the Bag Filter, and by two orders of magnitude for the Cyclone.
Conclusions
- The benefit of using a systematic calculation tool to ascribe the residual risk of explosion safety system failure has been shown by reference to a practical process-industry example.
- By electing appropriate input assumptions and representative data to set out ignition probabilities and consequence of flame transfer, a meaningful measure of residual risk that an installed explosion protection measure will fail to mitigate an explosion incident can be determined.
- A software design support tool is clearly possible from the described calculation means.
- Residual risk determination is critically dependent on the detail of the elected explosion protection system. In this paper we have shown by reference to a practical example that the installation of an explosion isolation means, in this case a fast‑acting valve located at 3 m from the duct mouth rather than the prescribed 5.5 m, has important implications on overall process safety.
- Options to improve the design of explosion isolation include the incorporation of optical detection and electing a faster isolation means, and are shown to represent safety system enhancements for this example. However, the most profound change in the residual risk of failure was demonstrated by electing explosion suppression rather than explosion venting on connected vessels, and thereby significantly reducing the probability of flame transfer.
- We have shown that by determining the residual risk of failure, it is possible to select and quantify the safety integrity of explosion protection options. Through this process design, engineers and operators can make better and informed decisions, leading to enhanced safety integrity and cost effectiveness in delivering overall process safety.
Acknowledgements
The authors would like to thank Professor Gautam Mitra and Dr Paresh Date from the Center for the Analysis of Risk and Optimisation Modelling Applications, Brunel University for their work in devising the mathematical methodology employed for the computation of residual risk. We also would like to thank Robert Pallant from Kidde Research for his help in data analysis and its interpretation, together with his interest in this work.
Nomenclature
QE (i) I Ignition probability in vessel i.
Pred (i, j) Reduced explosion pressure in vertex i following an ignition in vertex j.
Ps (i) Pressure shock resistance of vertex i.
Qvessel (i, j) P P Probability that the explosion protection hardware does not fail, but the reduced explosion pressure is still higher than the pressure shock resistance of the vessel
tb (i, j) Time from ignition for the isolation barrier to be established between vessels i and j
tf (i, j) Time taken for the flame front to arrive at the barrier location between vessels i and j
Qbarrier (i, j) Probability that the isolation hardware is actuated and the barrier established, but the barrier is deployed too late and flame passes from vessel i to j
Q f s (i, j) Probability of flame propagation between connected vessels i and j which then leads to an enhanced explosion in j.
Qs (i, j) Total flame propagation probability from vessel i to j which then leads to an enhanced explosion in j, taking into account any explosion isolation provision
Qh (i, j) Probability of explosion isolation hardware failure between vessels
i and j
Qh (i) Probability of explosion protection hardware failure on vessel i
ζ1 Residual risk of failure of vessel i due to an ignition in the same vessel or any vessel directly connected
Φj The set of vertices adjacent to vertex i.
V1 Source vessel where ignition occurs
V2 Vessel connected to V1
d Distance of explosion isolation barrier from the source vessel
dmin Minimum barrier distance from the source vessel such that tb (i, j) = tf (i, j)
Lpress radius of the ignition locus at which tf (i, j) = tb (i, j) when using pressure detection
Lopt radius of the ignition locus at which tf (i, j) = tb (i, j) when using optical detection
References
Date, P., Lade, R. J., Moore, P. E., Mitra, G., 2008, Modelling the Residual Risk of Safety System Failure, submitted to Operations Research, INFORM S.
Moore, P. E., Dunster, R. G., 2001, Improved Effectiveness in Explosion Suppression, VDI Berichte
Eckhoff, R., 2003, Dust Explosions in the Process Industries, Elsevier.
Ganguly, T., Date, P., Mitra, G., Lade, R. J. & Moore, P. E., 2007, A method for computing the residual risk of safety system failure, in `Proceedings of 12th International Symposium on Loss Prevention and Safety Promotion in the Process Industries’
Gexcon, 2005, FLACS: (FLame ACceleration Simulator), Gexcon AS, Bergen, Norway.
Holbrow, P., Andrews, S., Lunn, G. A., 1996, Dust Explosions in Interconnected Vented Vessels, J Loss Prevention Process Industries, 9(1): 91-103.
Jeske, A., Beck, H., 1997, Dokumentation Staubexplosionen, Analyse und Einzelfalldarstellung, BIA –Report NR. 4/82
Lunn, G. A., Holbrow, P., Andrews, S., Gummer, J., 1996, Dust Explosions in Totally Enclosed Interconnected Vessel Systems, J Loss Prevention Process Industries, 9(1): 45-58.
Moore, P., E., Spring, D., J., 2005, Design of Explosion Isolation Barriers, Trans IChemE, Part B, Process Safety and Environmental Protection, 83(B2): 161-170
Siwek, R., Cesana, C., 2001. Software for Explosion Protection, WinVent and ExTools, Safe Handling of Combustible Dusts, VDI Bewrichte 1601, Nuremberg
West, D., 2001, Introduction to Graph Theory, Prentice Hall.
Source: https://bit.ly/2NZ0y6y
Registered
4
Average
daily search
70%
Effective
search
234
Registered
companies
You are using BETA version.
Send feedback